- Cryptoassets continued to recover despite a more hawkish guidance by the Fed
- Our in-house “Cryptoasset Sentiment Index” has stabilized and remains slightly bearish
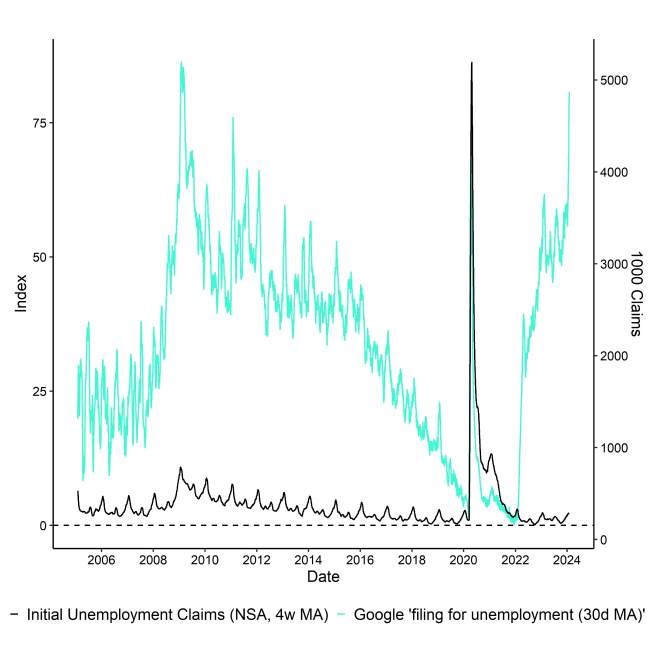
- Despite the supposedly strong non-farm payrolls report last Friday, we see increasing evidence of a weakening labour market in the US

Chart of the Week
Performance
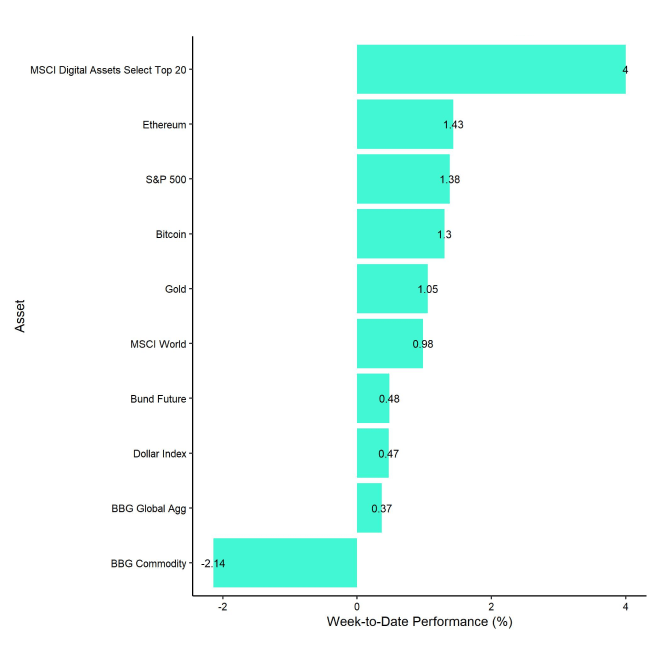
Last week, cryptoassets continued to recover on the back of positive net inflows into US spot Bitcoin ETFs and an improving cryptoasset sentiment.
Nonetheless, these positive developments were somewhat overshadowed by a more hawkish guidance by the Fed that guided markets towards later-than-expected interest rate cuts.
Before the FOMC meeting started on Tuesday last week, rates traders had expected the rate cutting cycle to commence in March, which was priced out to May 2024 after the FOMC meeting. This stance was somewhat confirmed with the latest non-farm payrolls jobs numbers on Friday that were significantly above consensus expectations, and which implied that the US labour market was still running hot.
This implied a “higher for longer” interest rate expectation which also led to a significant increase in long-term Treasury yields.
All of this happened during a week where another US regional bank's stock price unexpectedly sold off on account of high loan loss provisions and dividend cuts due to its high US commercial real estate loan exposure. Systemic risks appear to be resurfacing after a Japanese bank with significant US commercial real estate exposure also unexpectedly sold off last week.
A “higher for longer” stance of monetary policy by the Fed appears to induce renewed weakness in the (regional) banking system which is why we expect that the Fed will most-likely not be able to prolong its current pause in the interest rate cycle for much longer before commencing the rate cutting cycle.
Moreover, although the latest jobs report appears to confirm the Fed's more hawkish stance at first sight, a view beneath the strong headline numbers reveals that most of the job gains were related to increases in multiple job holders and part-time workers. In addition, leading labour market indicators such as average hours worked have declined to levels last seen during the Covid recession.
So, while overall payrolls are increasing, it appears as if companies are reluctant to increase full-time jobs as they are already reducing working hours. This is rather a sign of a weakening labour market.
What does that mean for Bitcoin and cryptoassets?
We still measure a significant dominance of global growth expectations for Bitcoin – around 55% of performance variations in the price of Bitcoin could be explained by changes in global growth expectations over the past 6 months.
However, that dominance has been gradually receding in favour of an increasing relevance of monetary policy and US Dollar changes which have accounted for 22% and 13%, respectively, in the variation in the price of Bitcoin over the past 6 months.
Based on these calculations, we expect that any weakness in global growth expectations due to a US recession could affect Bitcoin negatively at first but could also provide a tailwind as a second order effect due to a reversal in monetary policy expectations and a weaker US Dollar.
This would be similar to the performance patterns that we observed during the collapse of Silicon Valley Bank (SVB) in March 2023. We could see a revival of that since Bitcoin is one of the few counterparty risk-free assets and systemic risks in the traditional banking system could induce some kind of “flight-to-safety” into Bitcoin.
A reversal in monetary policy is most likely sparked by either a systemic weakness in the banking system or a significant increase in the unemployment rate over the coming months.
In our last report, we stated that we expected the influence of macro factors on Bitcoin & Cryptoassets to reassert itself over the coming weeks. This expectation already seems to materialize with the latest macro developments.
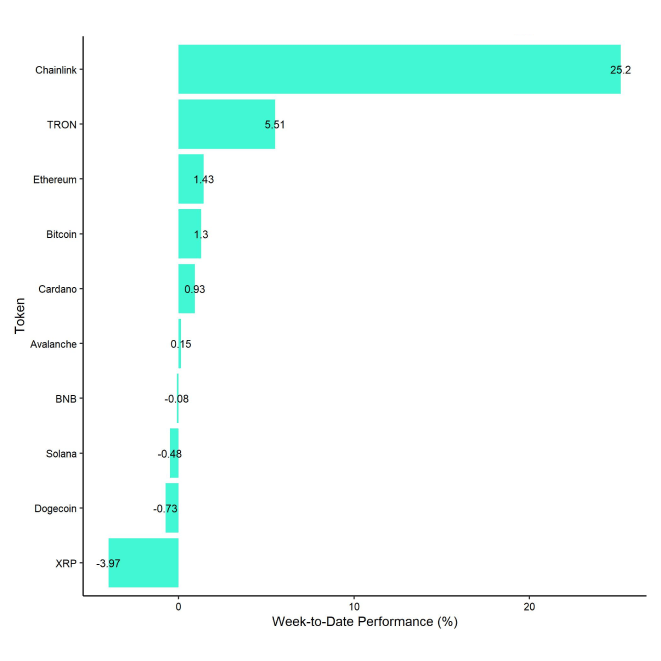
In general, among the top 10 crypto assets, Chainlink, TRON, and Ethereum were the relative outperformers.
Chainlink's recent partnership with China's national Blockchain Services Network, which utilizes Chainlink's oracle network, has likely boosted investor confidence and contributed to the recent price increase.
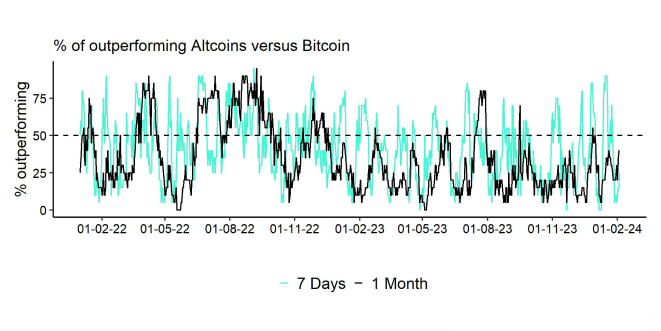
Nonetheless, altcoin outperformance vis-à-vis Bitcoin was relatively weak, with only 25% of our tracked altcoins managing to outperform Bitcoin on a weekly basis.
Sentiment
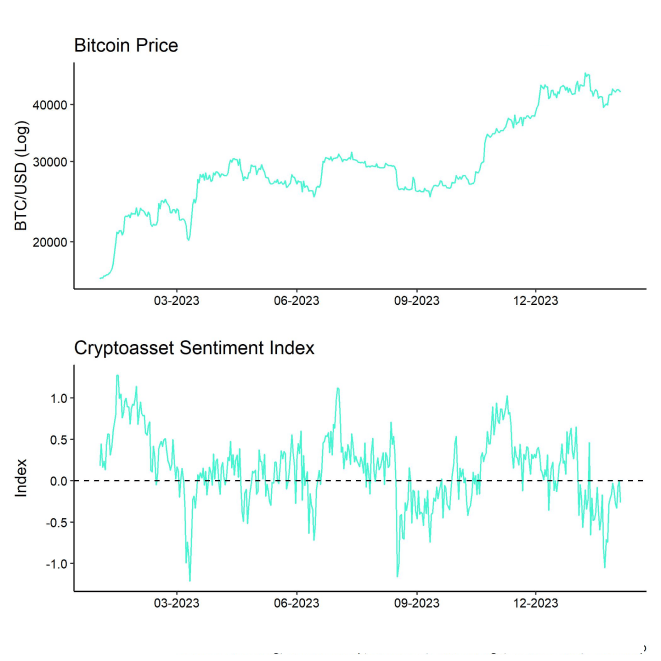
Our in-house “Cryptoasset Sentiment Index” has stabilized and remains slightly bearish.
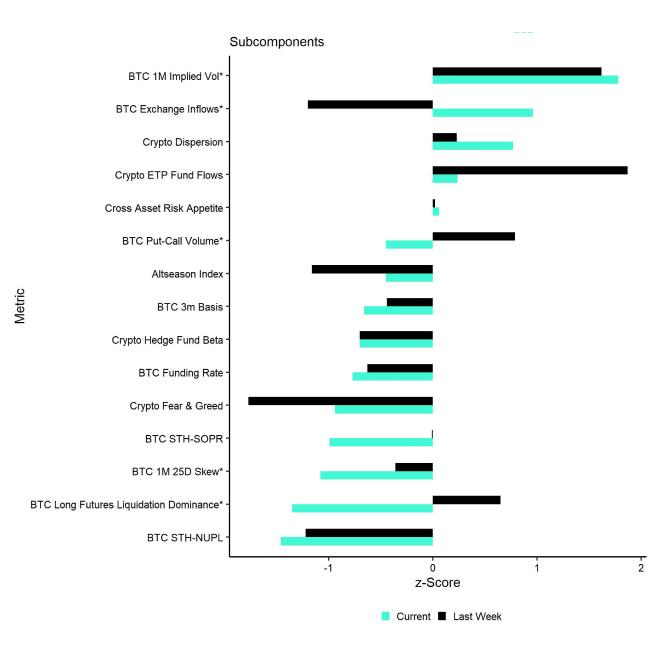
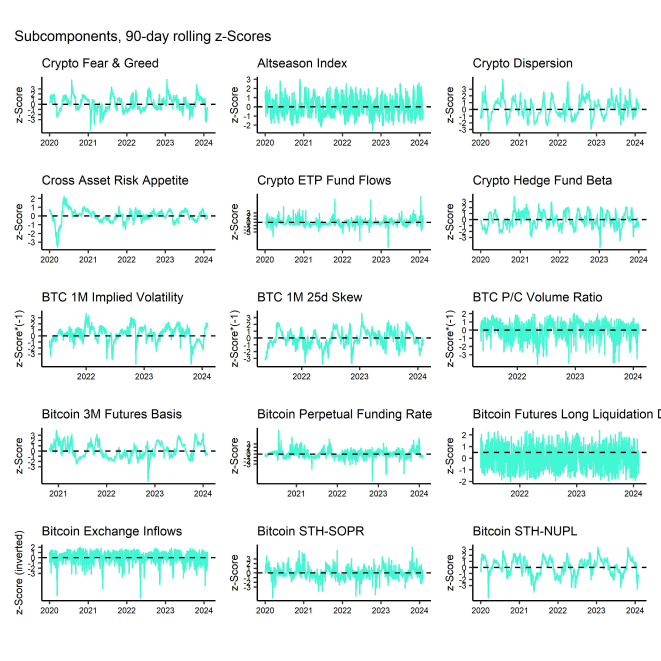
At the moment, only 5 out of 15 indicators are above their short-term trend.
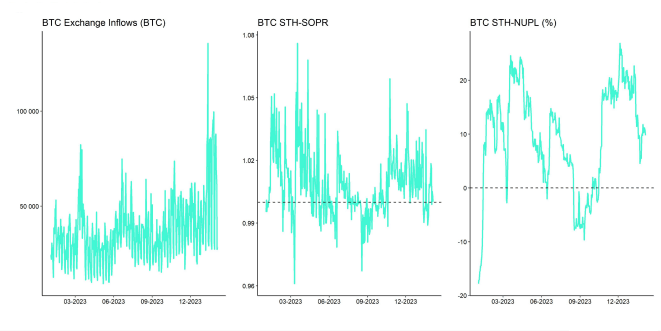
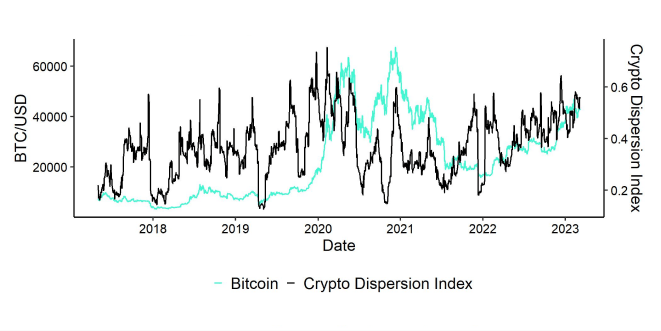
Compared to last week, we saw major reversals to the upside in BTC exchange inflows and the crypto dispersion index. The former implies lower exchange in flows which tends to be bullish and the latter implies increasing performance dispersion among cryptoassets which also tends to be a positive signal.
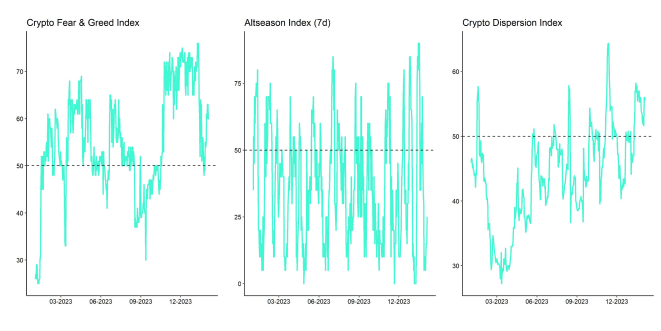
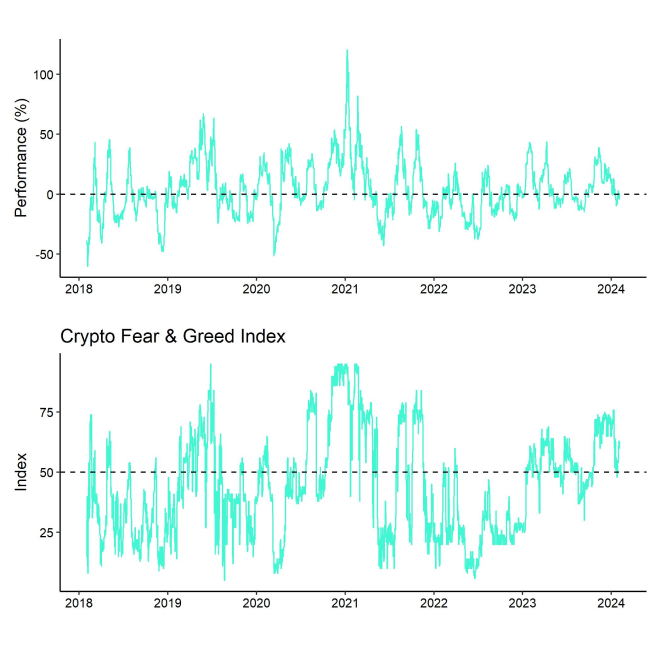
The Crypto Fear & Greed Index remains in "Greed" territory as of this morning.
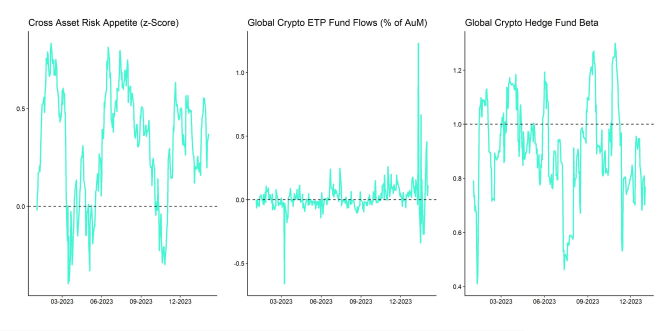
Meanwhile, our own measure of Cross Asset Risk Appetite (CARA) has recently increased as well albeit from lower levels. Overall, this is signalling a rather neutral sentiment in traditional financial markets.
As mentioned before, performance dispersion among cryptoassets has remained relatively high.
In general, high-performance dispersion among cryptoassets implies that correlations among cryptoassets have decreased, which means that cryptoassets are trading more on coin-specific factors and that diversification among cryptoassets is high.
At the same time, altcoin outperformance vis-à-vis Bitcoin was still relatively low, with no clear outperformance of Ethereum vis-à-vis Bitcoin. Viewed more broadly, only 25% of our tracked altcoins have outperformed Bitcoin on a weekly basis.
In general, low altcoin outperformance tends to be a sign of low risk appetite within cryptoasset markets.
Fund Flows
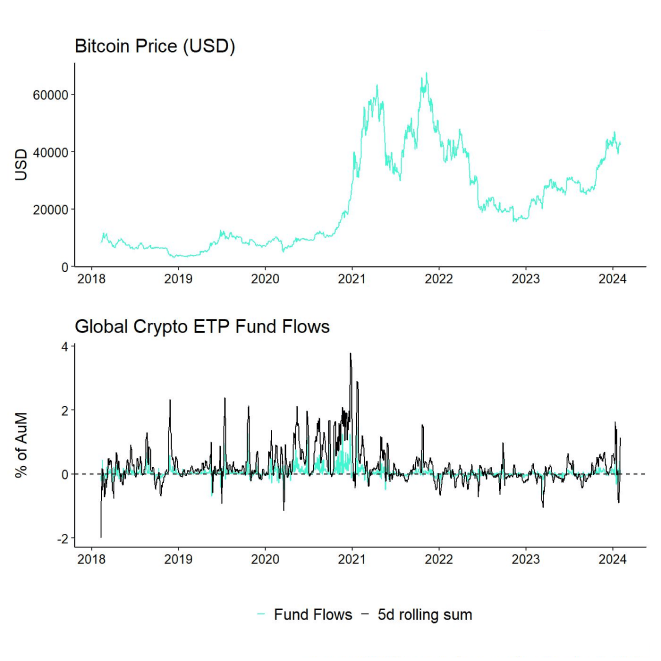
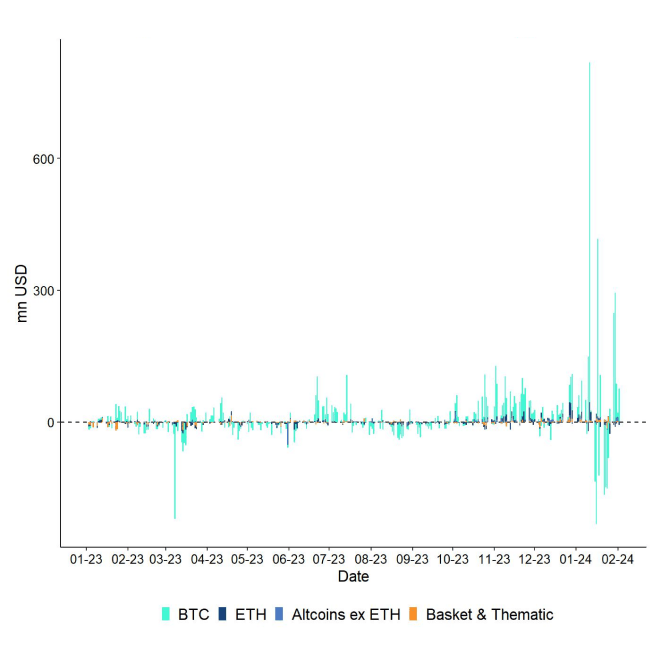
Overall, we saw net fund inflows in the amount of +698.9 mn USD (week ending Friday) based on Bloomberg data across all types of cryptoassets.
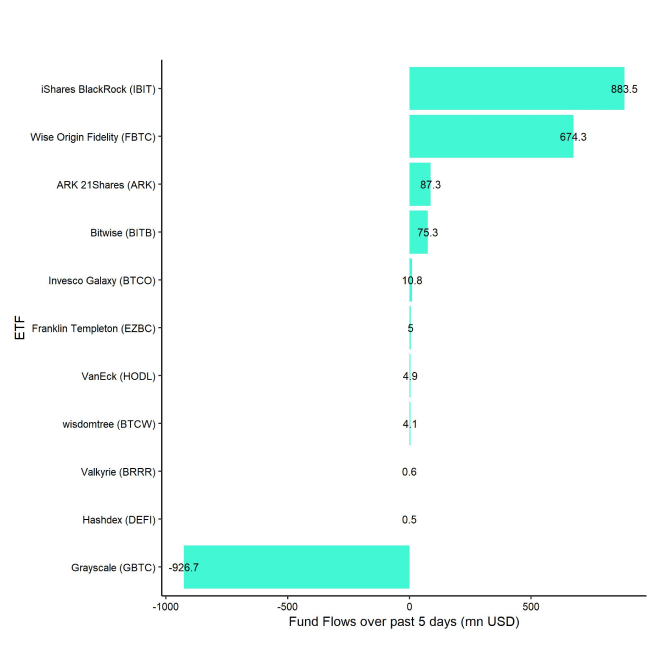
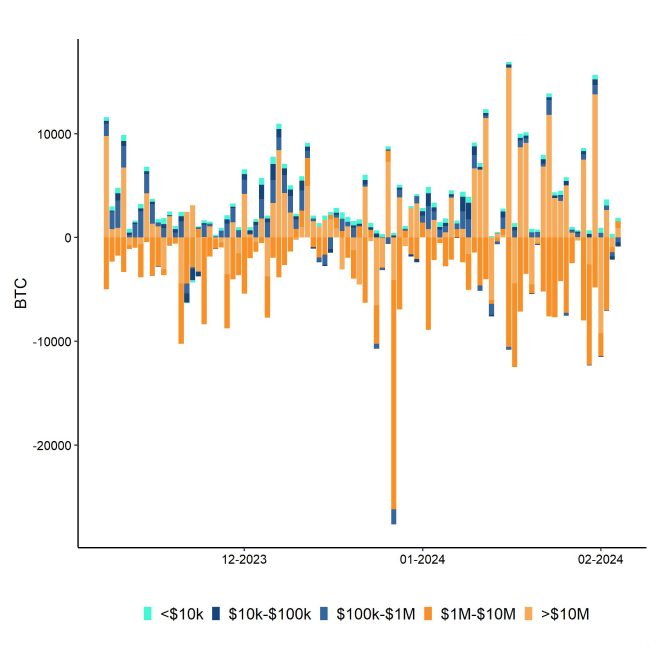
Global Bitcoin ETPs saw a reversal compared to last week with significant net inflows of +697.3 mn USD of which +819 mn (net) were related to US spot Bitcoin ETFs alone.
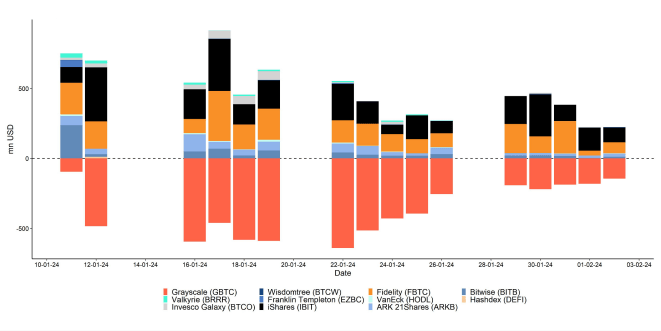
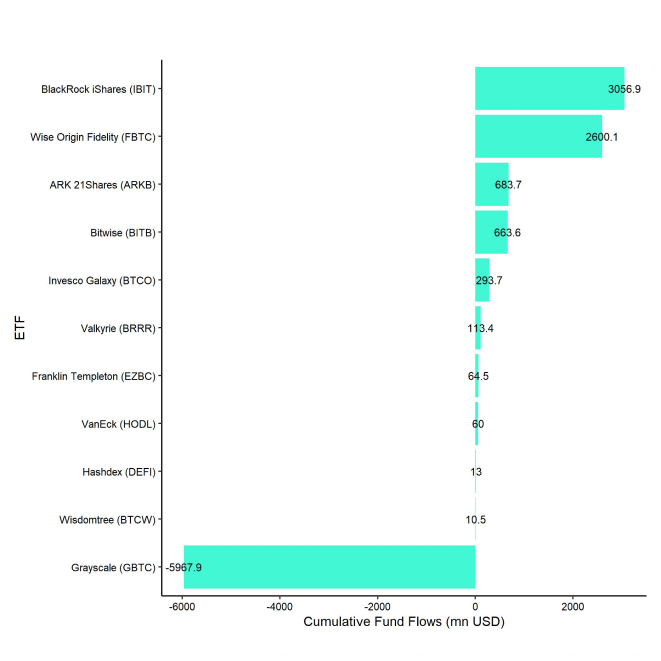
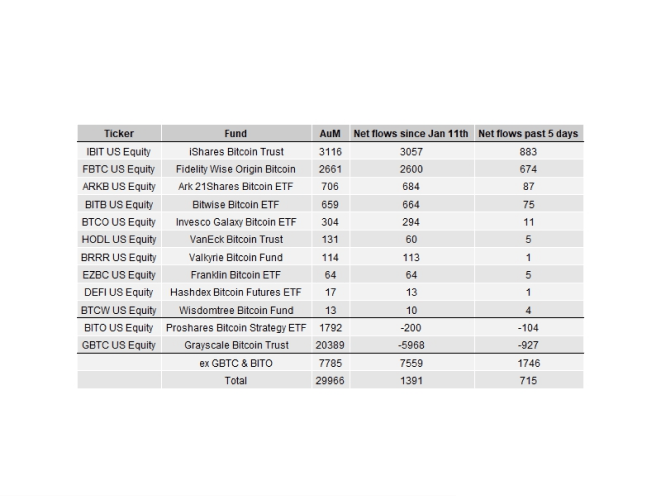
The Grayscale Bitcoin Trust (GBTC) continued to see net outflows of around -927 mn USD last week. This was more than offset by net inflows into other US spot Bitcoin ETFs that were able to attract +1,746 mn USD in net inflows. BlackRock's iShares Bitcoin Trust (IBIT) took in +883 mn USD last week and surpassed 3 bn USD in AUM.
On a positive note, the outflows from GBTC continued to slow down over the past 5 trading days and last Friday saw the lowest daily net outflow since trading launch on the 11/01.
Note that some fund flows data for US major issuers are still lacking in the abovementioned numbers due to T+2 settlement.
Apart from Bitcoin, we saw comparatively small flows into other cryptoassets last week.
Outflows from global Ethereum ETPs of around -22.2 mn USD were somewhat offset by inflows into other altcoin ETPs ex Ethereum that managed to attract +23.6 mn USD last week.
Thematic & basket crypto ETPs were more or less unchanged, with only +0.2 mn USD in net inflows, based on our calculations.
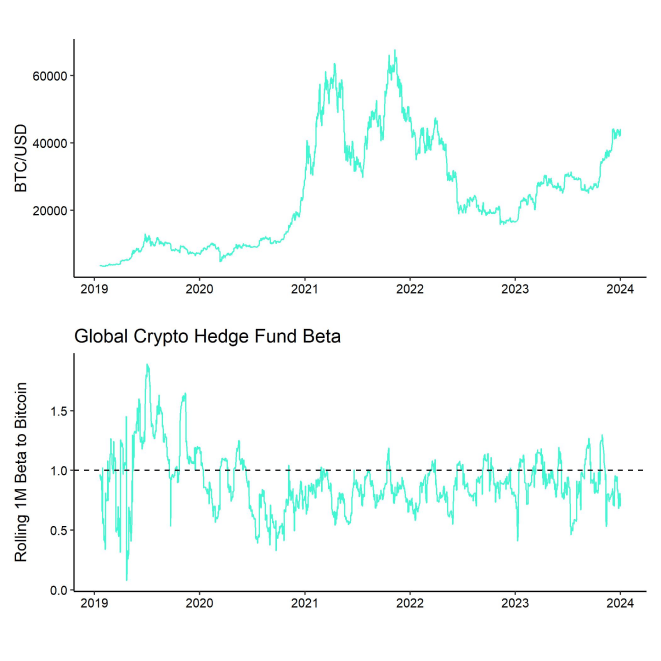
Besides, the beta of global crypto hedge funds to Bitcoin over the last 20 trading still remains low at below 0.8, implying that global crypto hedge funds still remain under-exposed to Bitcoin market risks. It appears as if crypto hedge funds are still waiting on the sidelines for new catalysts.
On-Chain Data
Core on-chain for Bitcoin remain somewhat mixed. For instance, active addresses as well as new addresses remain relatively low and also the number of addresses with non-zero balances has come off the recent highs. The same is true for the number of transactions on the core Bitcoin blockchain.
This happens amid a still relatively high count of inscriptions on the Bitcoin blockchain, implying that “pure” monetary transactions have been decreasing recently. The transaction count share of inscriptions had just recently reached an all-time high of 72% on the 28/01.
The share of inscriptions has reached around 61% this week as well. So, the share of inscriptions in Bitcoin transactions remains relatively high which is frequently a subject of discussion among the Bitcoin community. That being said, median transactions fees have declined significantly from their recent high from mid-December 2023 as have the share of fees in total BTC miner revenue which was between 5% and 15% last week.
Nonetheless, BTC miners continued to sell into their reserves last week which exerts some downward pressure on prices. Aggregate BTC miner reserves have reached the lowest level since July 2021.
However, in the grand scheme of overall exchange inflows, these exchange inflows are still comparatively small. Overall, exchange inflows remain very much dominated by ETF flows and whale deposits to exchanges (especially to Coinbase exchange).
All in all, net exchange transfers and deposits have recently been negative and BTC exchange balances have declined over the past week as a result. This implies overall increasing demand for Bitcoin. However, aggregate exchange balances have not reclaimed their multiyear lows yet.
In contrast, Ethereum exchange balances continue to drift lower and make fresh multiyear lows on a daily basis. This should provide a tailwind for the relative performance of Ethereum vis-à-vis Bitcoin.
Futures, Options & Perpetuals
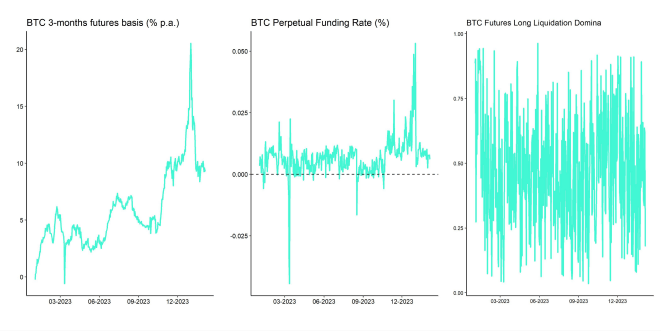
BTC futures open interest declined somewhat last week while perpetual open interest moved sideways. There were no significant futures long or short liquidations compared to the week prior.
The 3-months annualized BTC futures basis declined somewhat to around 9.4% p.a. but BTC perpetual funding rates remained positive throughout the week across major derivatives exchanges.
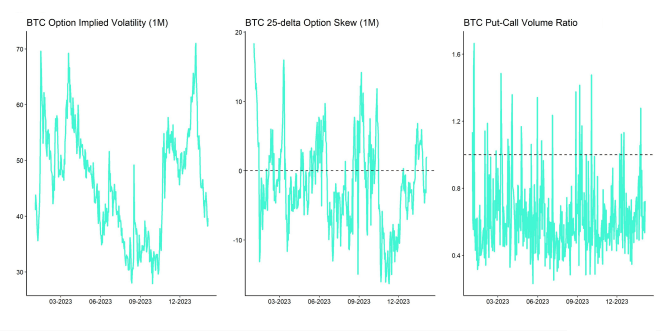
BTC options' open interest also remained relatively stable last week. Put-call open interest remains relatively low implying that most option traders are still engaged in calls and have a long bias. Put-call volume ratios also remained relatively low compared to the prior week implying that downside hedging activity has clearly levelled off.
That being said, BTC option traders have recently started to bid up the skew in favour of put options, implying renewed interest for downside hedges. At the time of writing delta-equivalent 1-month BTC put options have a 2%-points higher implied volatility than call options.
However, the declining trend in implied volatilities since early January 2024 also continued last week. At the time of writing, BTC ATM option implied volatility for 1-month options is around 39.6% which is significantly lower than the high of 71% reached on 07/01/2024.
Bottom Line
- Cryptoassets continued to recover despite a more hawkish guidance by the Fed
- Our in-house “Cryptoasset Sentiment Index” has stabilized and remains slightly bearish
- Despite the supposedly strong non-farm payrolls report last Friday, we see increasing evidence of a weakening labour market in the US
Appendix
Important information:
This article does not constitute investment advice, nor does it constitute an offer or solicitation to buy financial products. This article is for general informational purposes only, and there is no explicit or implicit assurance or guarantee regarding the fairness, accuracy, completeness, or correctness of this article or the opinions contained therein. It is advised not to rely on the fairness, accuracy, completeness, or correctness of this article or the opinions contained therein. Please note that this article is neither investment advice nor an offer or solicitation to acquire financial products or cryptocurrencies.
Before investing in crypto ETPs, potentional investors should consider the following:
Potential investors should seek independent advice and consider relevant information contained in the base prospectus and the final terms for the ETPs, especially the risk factors mentioned therein. The invested capital is at risk, and losses up to the amount invested are possible. The product is subject to inherent counterparty risk with respect to the issuer of the ETPs and may incur losses up to a total loss if the issuer fails to fulfill its contractual obligations. The legal structure of ETPs is equivalent to that of a debt security. ETPs are treated like other securities.


