- Performance: August saw significant declines in cryptoassets and traditional financial markets due to U.S. recession concerns and a sharp rise in the Japanese Yen. Despite this bearish sentiment, we anticipate a tactical bottom for Bitcoin, driven by expectations of looser Fed monetary policy, which could signal the start of a renewed bull run.
- Macro: The simultaneous macro and crypto sentiment capitulation in early August has provided a good basis for a more sustainable bottom in Bitcoin. In addition, we think that the fact that Bitcoin has become less sensitive to changes in global growth expectations, the turnaround in global monetary policy combined with a broad Dollar weakness could provide a very positive macro tailwind for Bitcoin and cryptoassets going forward.
- On-Chain: The persistent slowdown in on-chain capital flows into major cryptoassets still suggests that the current consolidation could continue. However, we are observing an improvement in on-chain signals across different indicators that suggest an improvement in overall on-chain activity in bitcoin. Significant sources of selling pressure such as the BTC miner capitulation are already behind us and also the Mt Gox distribution is already 2/3rds completed. Bitcoin whales have become net accumulators of bitcoin again and net buying volumes on spot exchanges have also reversed to a 3-month high more recently signalling a renewed increase in risk appetite.
Chart of the Month
Performance
August was characterized by a severe drawdown in cryptoassets and traditional financial assets due to increasing US recession woes. The main catalyst was the disappointing US jobs report for July that showed an increase in the US unemployment rate, which triggered many popular recession indicators such as the “Sahm Rule”.
Furthermore, the sharp appreciation of the Japanese Yen sent shock waves through traditional financial markets as carry traders unwound their positions due to an increase in Japanese key interest rates by the Bank of Japan, which exacerbated flight-to-safety in early August.
As a result, cryptoasset sentiment plunged to the lowest reading since November 2022 – when FTX collapsed. This pronounced bearishness in crypto markets also coincided with a significant decline in cross asset risk appetite in traditional financial markets.
That being said, we think the combination of the macro and crypto sentiment capitulation in early August most likely marked a significant tactical bottom in Bitcoin and consequently also marked the beginning of a renewed bull run.
One of the major reasons for this expectation is the fact that financial markets were quick to price in a reversal in Fed monetary policy following these market ructions at the beginning of August, which were also recently confirmed by the latest deliberations by Fed chairman Powell at the central bank symposium in Jackson Hole, Wyoming.
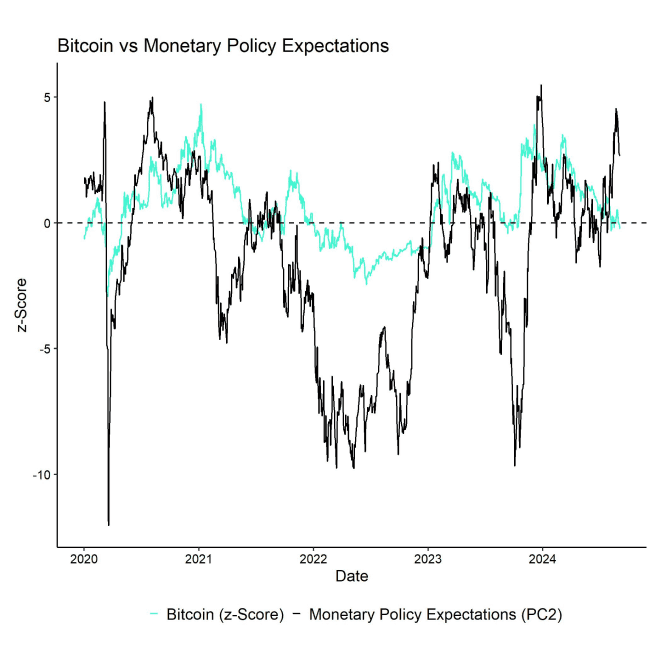
Powell has now clearly communicated that a reversal in Fed monetary policy is imminent amid the weakening labour market and is very likely to commence this month. Expectations of looser monetary policy are bound to provide a positive tailwind for Bitcoin and cryptoassets over the coming months (Chart-of-the-month).
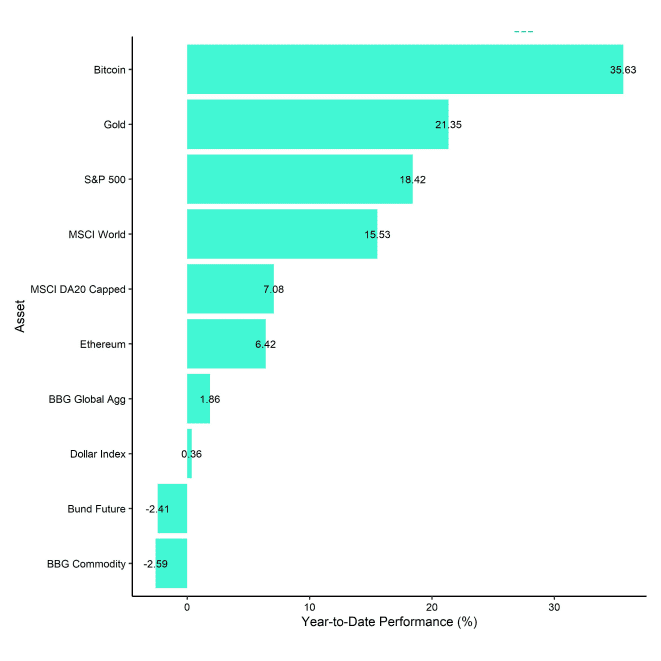
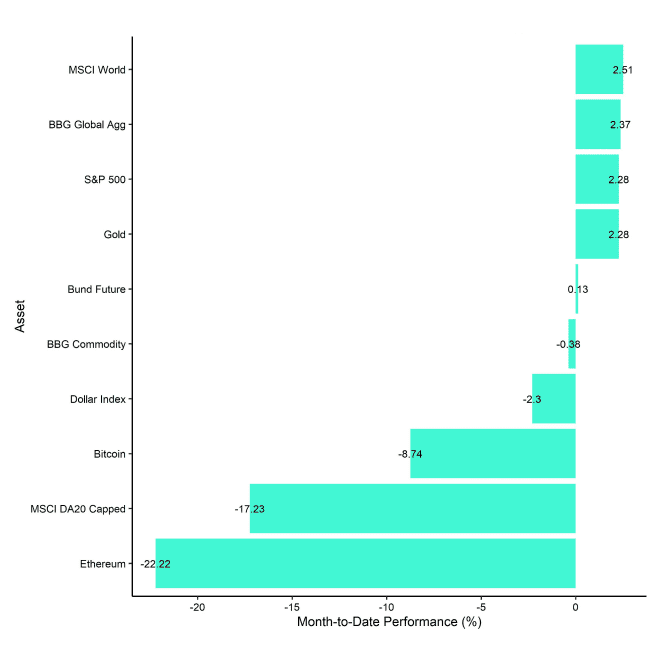
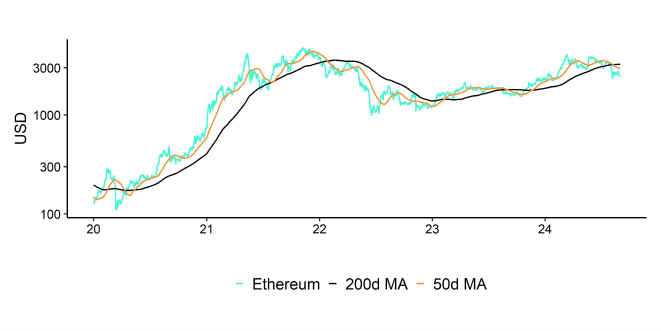
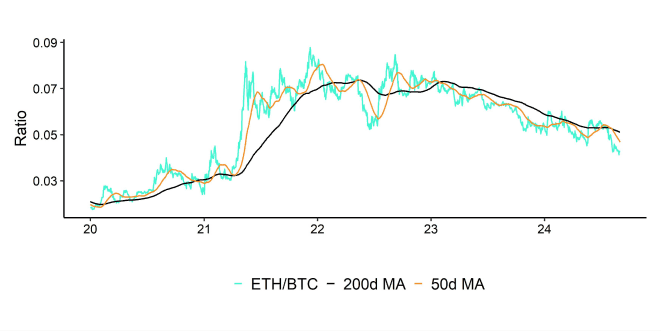
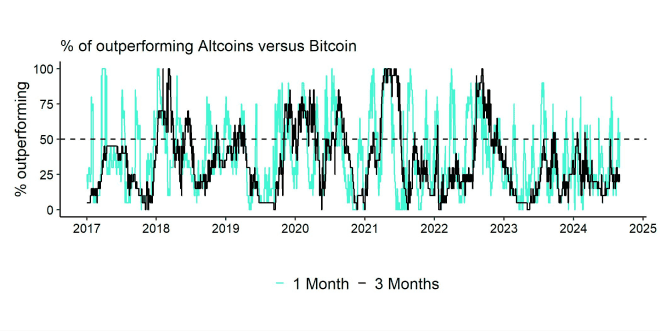
Altcoins also generally underperformed Bitcoin in August, consistent with the general decline in risk appetite and bearish sentiment. Ethereum also underperformed Bitcoin significantly. Ethereum's underperformance has been associated with many factors amongst others the large distribution of ETH by the Ethereum Foundation, an increase in short ETH futures positioning as well as persistent US Ethereum spot ETF net outflows, which were largely driven by continued outflows from Grayscale's Ethereum Trust (ETHE) though.
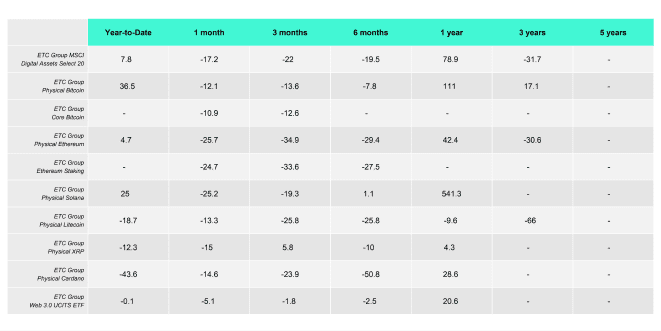
A closer look at our product performances also reveals that a significant underperformance of Ethereum and other altcoins vis-à-vis Bitcoin in August.
Bottom Line: August saw significant declines in cryptoassets and traditional financial markets due to U.S. recession concerns and a sharp rise in the Japanese Yen. Despite this bearish sentiment, we anticipate a tactical bottom for Bitcoin, driven by expectations of looser Fed monetary policy, which could signal the start of a renewed bull run.
Macro Environment
Probably the most significant macro event last month was the sell-off in traditional financial markets and cryptoassets on the 5th of August. Macro pundits associated the appreciation of the Japanese Yen (JPY) with being one of the key catalysts for this sell-off.
As is widely known among institutional investors, the Yen is traditionally being used as a funding currency in a so-called “carry trade” on account of its low interest rates relative to other currencies.
In general, in a carry trade, investors tend to borrow the low-yielding currency and tend to buy higher-yielding assets in other regions, profiting from the spread in yields. In other words, they are “short” the low-yielding currency (Yen) and “long” other higher yielding currencies.
Until mid-July, Yen carry traders had additionally profited from a structural depreciation of the Yen against other major currencies, such as the US Dollar. However, this started to reverse in July as relative monetary policy expectations between the Bank of Japan (BoJ) and the Fed diverged as the BoJ exited its long-held negative interest rate policy and raised its benchmark rate to 0.25% in late July.
As carry traders unwound their positions, they had to sell foreign currency assets and buy back their short Yen positions, which led to the sharp appreciation of the Yen.
However, in this context it is worth pointing out that JPY appreciations tend to be a normal phenomenon within broader risk-off environments that are associated with a flight-to-safety into traditional hard currencies like the Yen or the Swiss Franc.
We think that the JPY appreciation of the Yen is consistent with a much broader weakness in global growth expectations emanating from increasing US recession risks.
This observation is also consistent with the persistent rallye in the price of gold amid flight-to-safety and increasing expectations of a Fed monetary policy pivot.
In this regard, cryptoassets were recently supported by clear signals for a pivot in Fed monetary policy following dovish remarks by Fed chairman Powell at the recent central bank symposium in Jackson Hole.
Powell's comments were dovish across the board and essentially signalled that the Fed can no longer tolerate a deterioration in labour market conditions in favour of maintaining price stability, i.e. lowering inflation. More specifically, the following remarks by Powell were interpreted by markets as a clear signal towards an imminent shift in monetary policy and rate cuts in September:
The time has come for policy to adjust. The direction of travel is clear, and the timing and pace of rate cuts will depend on incoming data, the evolving outlook, and the balance of risks.
Powell's remarks essentially confirmed what Fed Funds Futures markets have already been anticipating following the capitulation event in early August 2024 – initial rate cuts starting in September. The latest payroll benchmark downward revisions, which suggested that past payroll growth was much lower than previously estimated, made the case for rate cuts in September even stronger.
Our own market-based measure of monetary policy expectations is now clearly signalling positive expectations for monetary policy. This is bound to provide a positive tailwind for Bitcoin and other cryptoassets over the coming months:

At the time of writing, Fed Funds Futures already price in slightly more than 9 cuts à 25 bps each and a terminal rate of 3% which will be reached by the end of 2025. So, markets are already anticipating significant cuts to the Fed Funds target rate.
However, as outlined in previous Bitcoin Macro Investor reports, our base case remains for a US recession to materialise.
It could very well be that the US economy is already sliding into a recession as we speak.
In case of a recession, it is quite likely that markets will price in even more Fed cuts since the average reduction in the Fed Funds Rate during past US recessions has been around -340 basis points (median: -300 basis points):
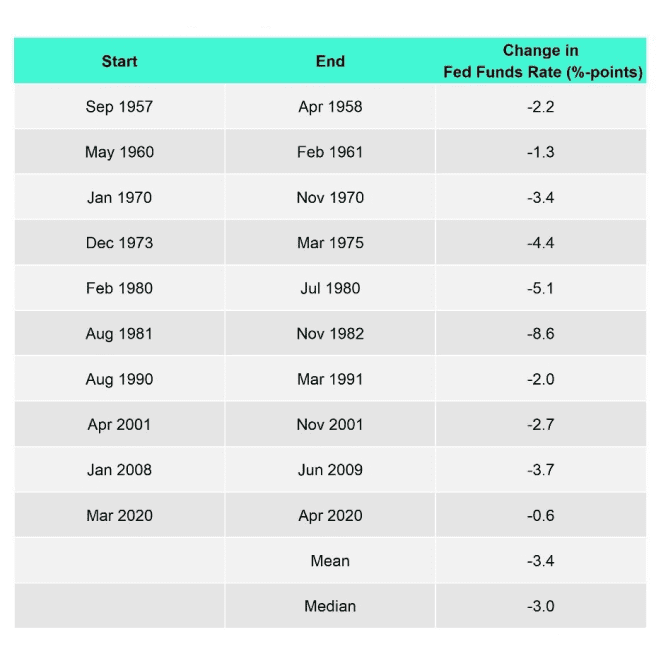
One of the key reasons for a US recession to materialise is that many prominent recession rules based on US unemployment data such as the “Sahm Rule” as well as the “Mel Rule” have already been triggered which are clear signals of an imminent recession.
Other reasons include the fact that the spread between expectations and present situation in the Conference Board consumer survey has increased to a new cycle high in July suggesting that we are entering a recession already. The spread between the prominent “jobs hard to get” and “jobs plentiful” sub-indicator also suggests that US consumers see labour market conditions clearly deteriorating.
Another reason to assume broad-based weakness in the US labour market is the fact that payroll growth has recently been significantly revised to the downside. More specifically, the BLS has revised total non-farm payroll growth for March 2024 period by -818k payrolls.
Labour market experts have raised concerns that the “birth/death” model used in the calculation of US payrolls has structurally been overestimating overall payroll growth.
It is quite likely that downward revisions to US payrolls will continue into the future as the establishment survey indicates a significant decline in establishment counts in the US, contrary to what the household survey and the payroll data are still implying.
So, BLS payroll statistics will most likely continue to overstate the “true” state of the US labour market until further revisions occur.
That being said, it is important to highlight that leading indicators of the unemployment rate are not yet signalling an imminent spike in layoffs. To the contrary, neither nation-wide WARN notices nor job cut announcements indicate a short-term increase in initial unemployment claims. However, this could change in Q4 as layoffs tend to be announced around the turn of the year.
The recent increase in the unemployment rate is rather stemming from a significant decline in job openings and hirings across the economy.
This is also evident in the continued decline in job openings signalled in both the LinkUp 10,000 data as well as job openings data published by Indeed which is consistent with official job openings statistics in the JOLTS data.
The big question for cryptoasset investors remains how a potential US recession could affect performance going forward?
There are several nuances to this question but we are generally observing the following market developments right now that make us optimistic:
1. The macro capitulation in early August coincided with a capitulation in crypto sentiment which significantly limits further downside.
Market-based global growth expectations hit a multi-year low on the 5th of August while our in-house Cryptoasset Sentiment Index hit the lowest level since November 2022, i.e. when FTX collapsed. A significant growth scare appears to be priced in already so that actual recession could have less of an impact on crypto performances going forward.
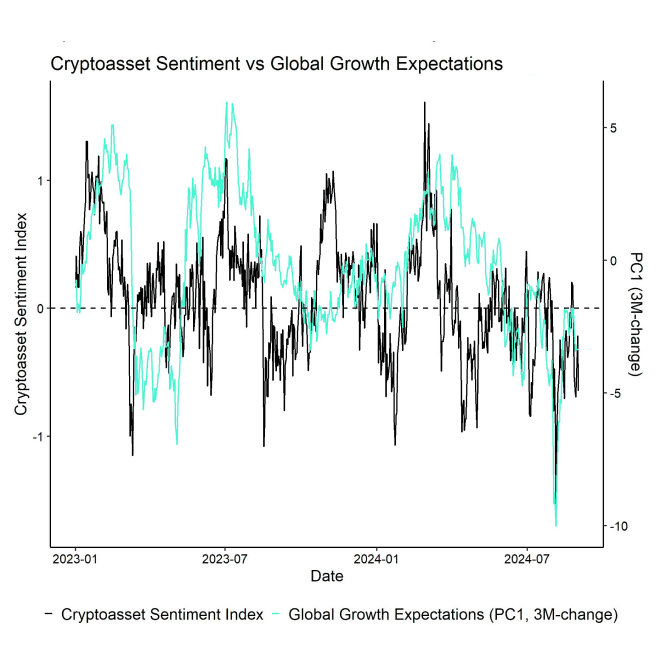
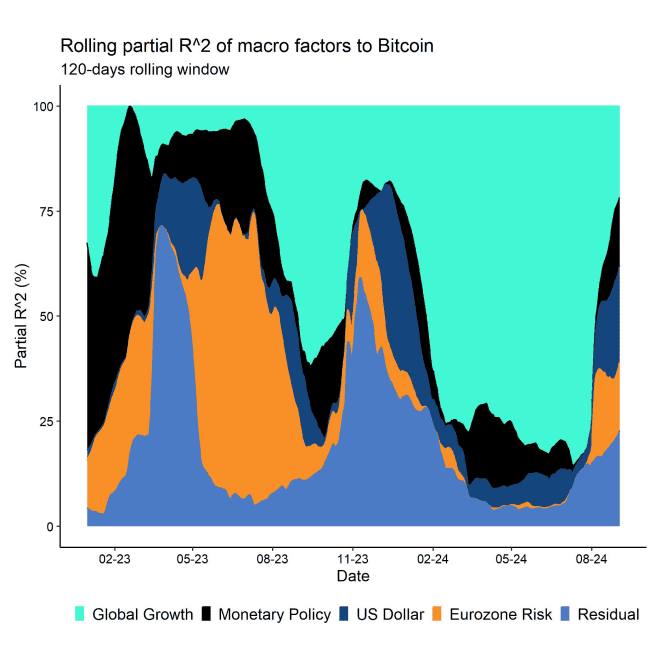
2. Bitcoin's sensitivity to global growth expectations is decreasing, making a potential US recession less of a risk for cryptoassets. To the contrary, we are shifting from headwinds (growth) to tailwinds (monetary policy, US Dollar).
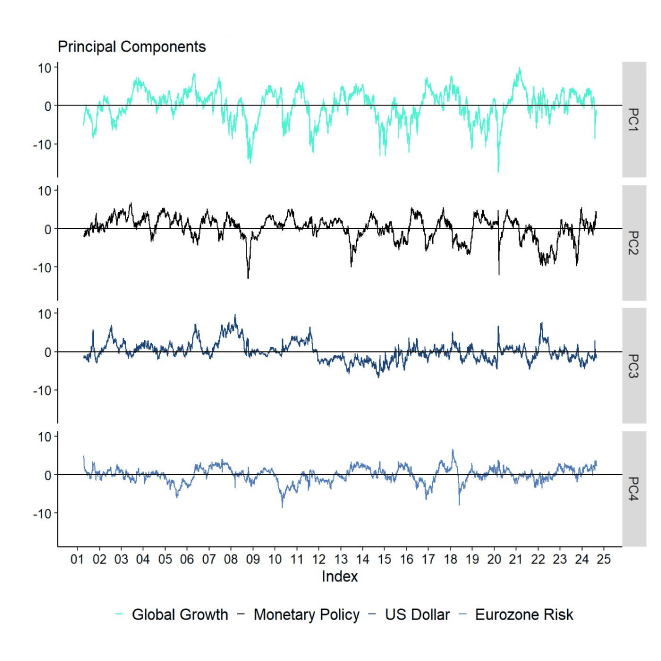
Our macro factor model implies that Bitcoin's performance over the past 120 days has been explained less by changes in global growth expectations (which have been a headwind) and more by other macro factors such as monetary policy expectations or the US Dollar (which have provided tailwinds). In particular, we are also seeing an increasing share in explanatory power by residual/non-macro/coin-specific factors for Bitcoin, which imply an increasing probability of Bitcoin to even decouple from increasing US recession risks.
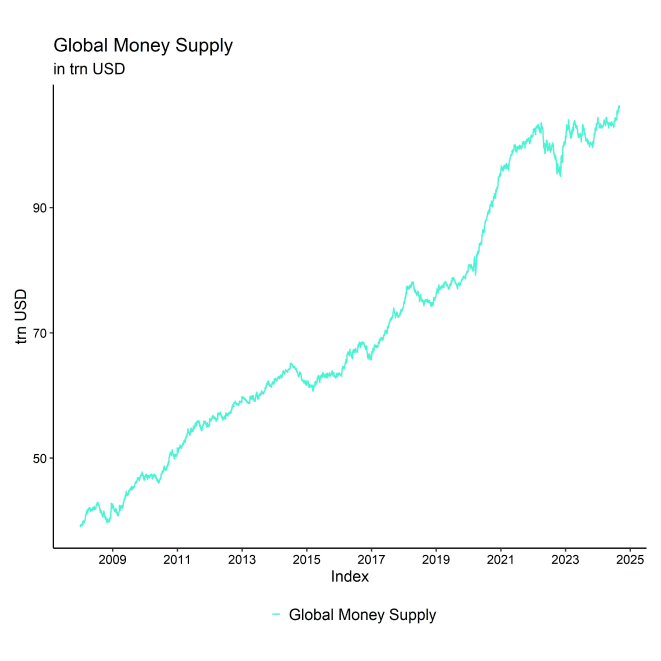
3. The monetary policy tide is turning and initial Fed rate cuts are imminent.
At the time of writing, Fed Funds Futures price a total of 9 cuts à 25 bps and a terminal rate of approximately 3% by the end of 2025. G5 central banks are shifting towards easing mode and global money supply has recently reached a new all-time high. Expansions in global money supply tend to be bullish environments for Bitcoin and cryptoassets.
4. The US Dollar has been weakening, which tends to be a bullish environment for Bitcoin and cryptoassets.
Weak Dollar environments tend to be best environments for Bitcoin and vice versa. A reversal in Fed monetary policy associated with interest rate cuts and Quantitative Easing (QE) tends to be Dollar bearish, which should provide a significant tailwind for Bitcoin and cryptoassets going forward.
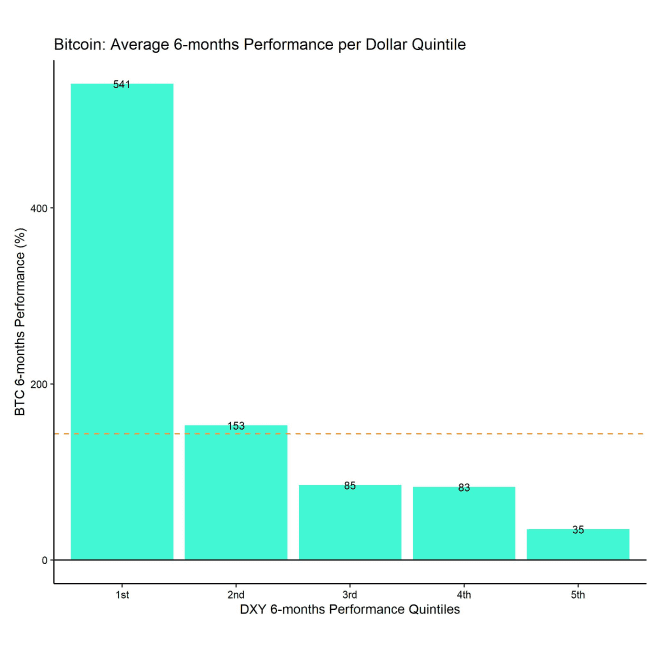
Orange dashed line denotes mean BTC performance over a 6-months time period
Bottom Line: The simultaneous macro and crypto sentiment capitulation in early August has provided a good basis for a more sustainable bottom in Bitcoin. In addition, we think that the fact that Bitcoin has become less sensitive to changes in global growth expectations, the turnaround in global monetary policy combined with a broad Dollar weakness could provide a very positive macro tailwind for Bitcoin and cryptoassets going forward.
On-Chain Developments
August can generally be described as a month where on-chain signals have started to improve again. For instance, it is worth highlighting that BTC miners have become net accumulators of bitcoin again as their mining reserves have been increasing since the end of July.
More specifically, bitcoin miners have only sold approximately 90% of their mined supply over the past month according to data provided by Glassnode, which is the lowest amount of relative sales since October 2023.
In this context, Bitcoin's hash rate has continued to increase to new all-time highs, which is also consistent with the fact that economic pressure on bitcoin miners has likely receded.
The increase in hash rate has also triggered a positive signal for the hash ribbons indicator originally proposed by Charles Edwards to identify BTC miner capitulation. This signal indicates that the BTC miner capitulation is most likely behind us.
We are generally observing an improvement in on-chain activity across different signals, albeit from lower levels. The chart below shows many different on-chain signals combined to give a broader picture of bitcoins on-chain activity:
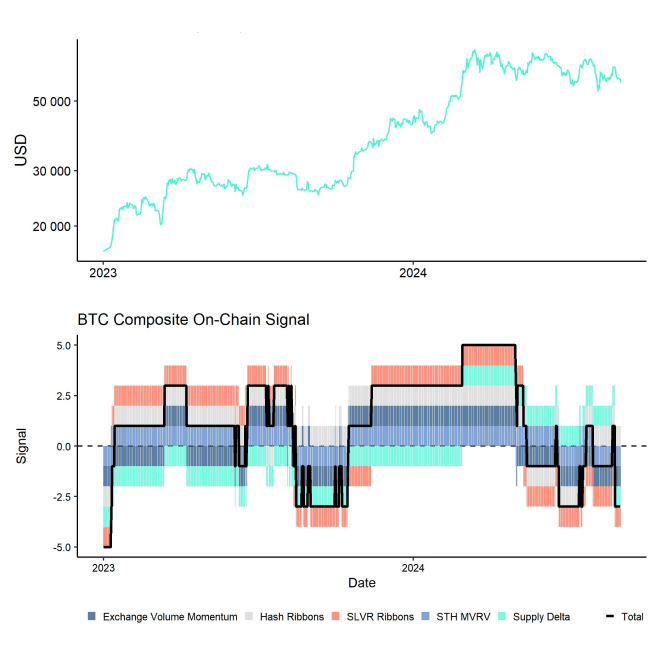
It is worth pointing out that some of these signals such as the SVLR ribbons are heavily influenced by mediocre exchange trading volumes on account of weak summer seasonality. Therefore, we expect these metrics to improve even further as we enter more favourable seasonality in Q4 2024.
The decline in BTC miner sales has removed a significant source of selling pressure. Other sources of selling pressure include the ongoing sales by the Mt Gox trustee. The wallets controlled by the trustee have only distributed around 1k BTC in August and there are still around 45k BTC left for sales, according to data provided by Arkham. However, it is quite likely that this supply distribution could have a lower price impact than usual as the former creditors will probably continue holding a larger proportion of these funds in bitcoin.
Besides, the US government sold approximately 10k BTC in mid-August and still controls around 203k BTC based on data provided by Arkham. These are the bitcoins that Trump and other Republicans have envisioned as a strategic reserve for the US. As such, this supply may not hit the market in the short term if Trump becomes the next president.
However, the latest odds imply a slight lead of Harris over Trump with 50.0% vs 48.2% according to an aggregate measure of different betting odds complied by electionbettingodds.com. So, there is an ongoing risk that these bitcoins could eventually be distributed.
On a positive note, bitcoin whales in general have started to accumulate bitcoins again judging by the recent shift in aggregate net exchange transfers by whales.
In August, whale exchange transfers have shifted from net deposits to net withdrawals signalling increasing accumulation into lower prices observed in early August:
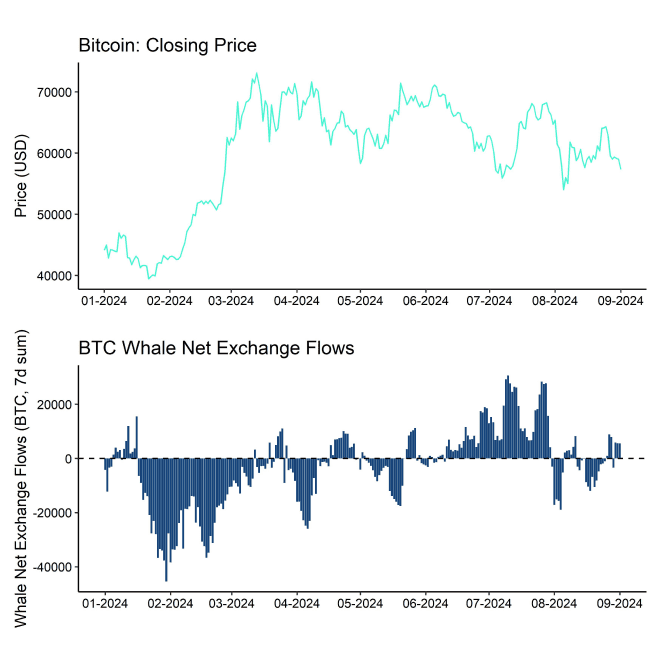
This renewed accumulation by whales is following the very pronounced capitulation in early August, which also coincided with severe macro capitulation as noted above. Our in-house Cryptoasset Sentiment Index has signalled the worst sentiment since November 2022, when FTX collapsed, which strongly suggested that a tactical bottom in bitcoin was very likely.
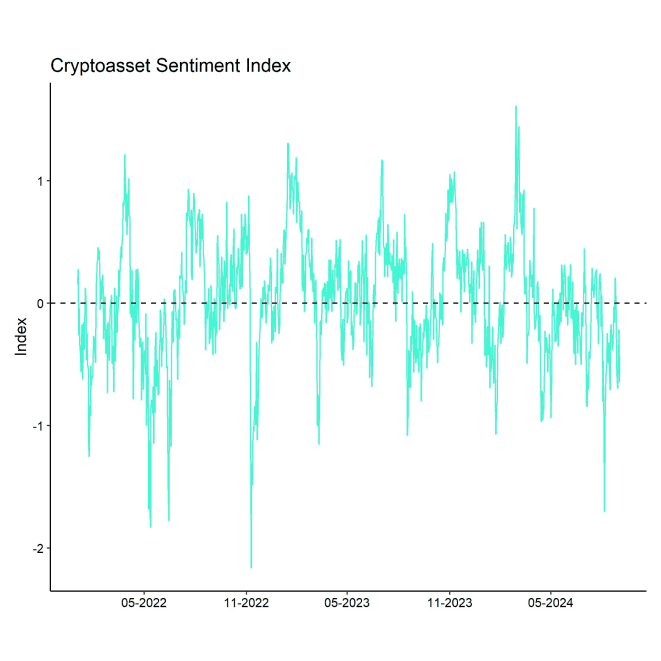
The severe decline in overall sentiment was largely driven by significant weakness in on-chain indicators such as the Short-Term Holder Spent Output Profit Ratio (STH SOPR) which suggested that short-term investors have decisively exited the market at a loss – a clear sign for capitulation.
Moreover, weekly net buying volumes on bitcoin spot exchanges have generally recovered in August and have reached a 3-months high, which was largely driven by an acceleration in net inflows into US spot bitcoin ETFs.
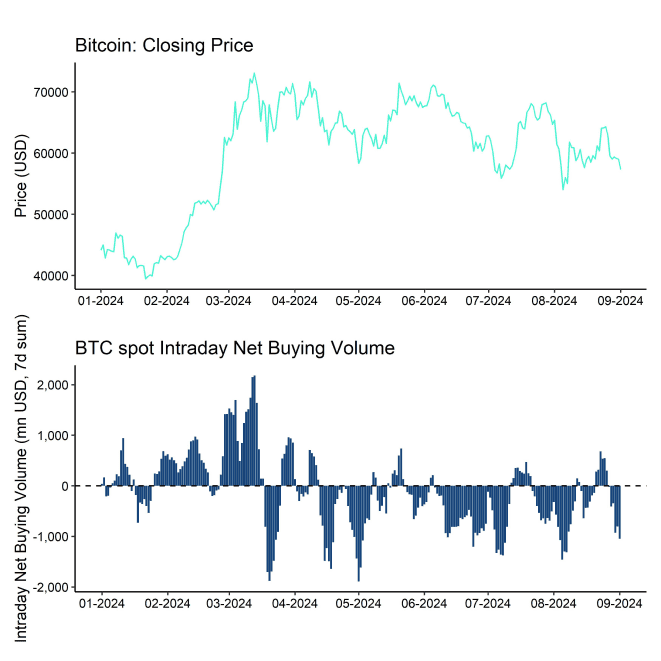
On a positive note, especially larger BTC wallets have generally started to increase their accumulation activity in August. However, we are seeing a continued decline in on-chain capital invested across the major cryptoassets Bitcoin and Ethereum. Over the past 30 days, there have been no net new capital investments on-chain, which is also consistent with the general downtrend in cryptoasset prices since the peak in on-chain capital flows recorded in March 2024. This could be related to weak summer seasonality and we are waiting for a decisive turnaround in these on-chain capital flows.
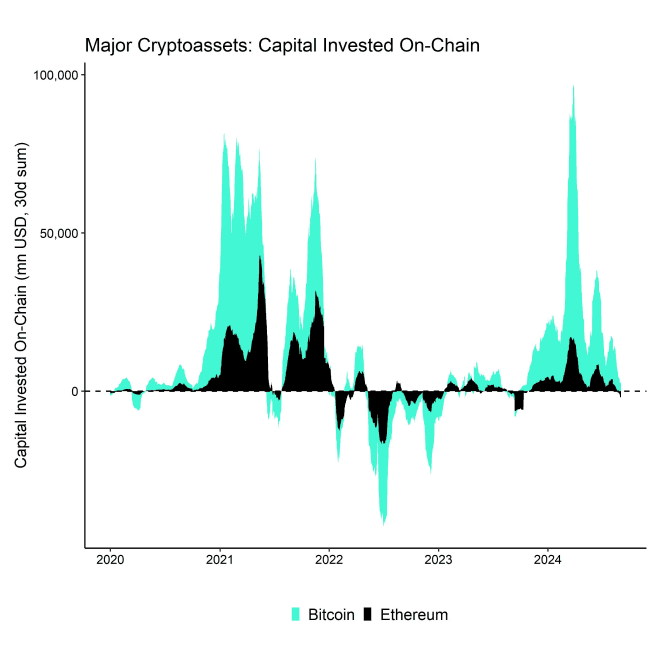
Bottom Line: The persistent slowdown in on-chain capital flows into major cryptoassets still suggests that the current consolidation could continue. However, we are observing an improvement in on-chain signals across different indicators that suggest an improvement in overall on-chain activity in bitcoin.
Significant sources of selling pressure such as the BTC miner capitulation are already behind us and also the Mt Gox distribution is already 2/3 rd s completed. Bitcoin whales have become net accumulators of bitcoin again and net buying volumes on spot exchanges have also reversed to a 3-month high more recently signalling a renewed increase in risk appetite.
Bottom Line
- Performance: August saw significant declines in cryptoassets and traditional financial markets due to U.S. recession concerns and a sharp rise in the Japanese Yen. Despite this bearish sentiment, we anticipate a tactical bottom for Bitcoin, driven by expectations of looser Fed monetary policy, which could signal the start of a renewed bull run.
- Macro: The simultaneous macro and crypto sentiment capitulation in early August has provided a good basis for a more sustainable bottom in Bitcoin. In addition, we think that the fact that Bitcoin has become less sensitive to changes in global growth expectations, the turnaround in global monetary policy combined with a broad Dollar weakness could provide a very positive macro tailwind for Bitcoin and cryptoassets going forward.
- On-Chain: The persistent slowdown in on-chain capital flows into major cryptoassets still suggests that the current consolidation could continue. However, we are observing an improvement in on-chain signals across different indicators that suggest an improvement in overall on-chain activity in bitcoin. Significant sources of selling pressure such as the BTC miner capitulation are already behind us and also the Mt Gox distribution is already 2/3rds completed. Bitcoin whales have become net accumulators of bitcoin again and net buying volumes on spot exchanges have also reversed to a 3-month high more recently signalling a renewed increase in risk appetite.
Appendix
Cryptoasset Market Overview
Cryptoassets & Macroeconomy

Cryptoassets & Multiasset Portfolios
Cryptoasset Valuations
On-Chain Fundamentals
Important information:
This article does not constitute investment advice, nor does it constitute an offer or solicitation to buy financial products. This article is for general informational purposes only, and there is no explicit or implicit assurance or guarantee regarding the fairness, accuracy, completeness, or correctness of this article or the opinions contained therein. It is advised not to rely on the fairness, accuracy, completeness, or correctness of this article or the opinions contained therein. Please note that this article is neither investment advice nor an offer or solicitation to acquire financial products or cryptocurrencies.
Before investing in crypto ETPs, potentional investors should consider the following:
Potential investors should seek independent advice and consider relevant information contained in the base prospectus and the final terms for the ETPs, especially the risk factors mentioned therein. The invested capital is at risk, and losses up to the amount invested are possible. The product is subject to inherent counterparty risk with respect to the issuer of the ETPs and may incur losses up to a total loss if the issuer fails to fulfill its contractual obligations. The legal structure of ETPs is equivalent to that of a debt security. ETPs are treated like other securities.
 En
En  Fr
Fr  De
De 