ETC Group Crypto Market Compass
Week 51, 2023
Editorial Update: The next Crypto Market Compass will be published on 02/01/2024 due to the Christmas holidays. We wish you a healthy and prosperous new year.
Editorial Update: The next Crypto Market Compass will be published on 02/01/2024 due to the Christmas holidays. We wish you a healthy and prosperous new year.

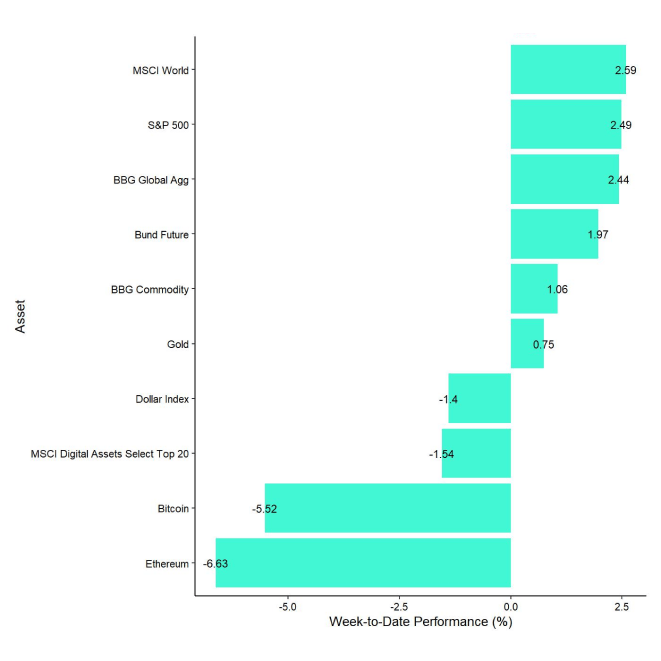
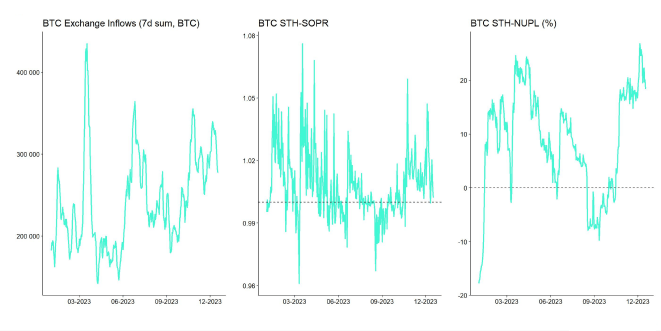
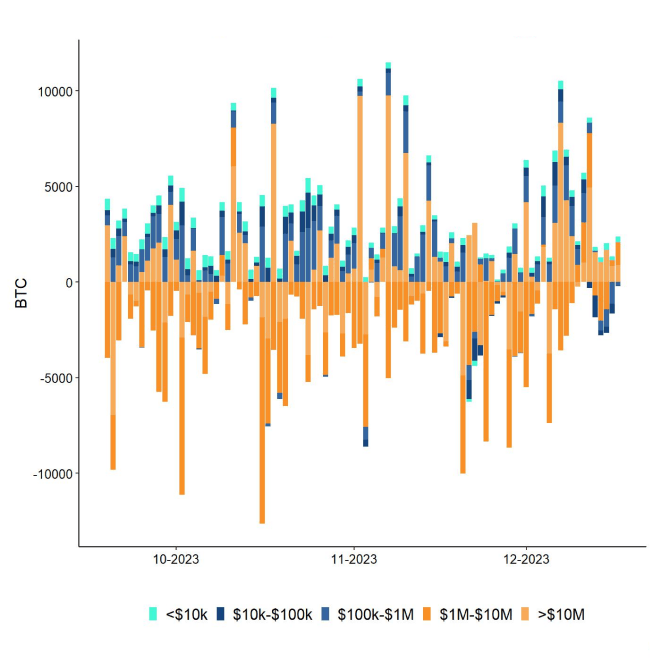
Last week, cryptoassets underperformed traditional assets on account of significant profit-taking by short-term bitcoin holders. In fact, last week saw the biggest bitcoin exchange transfers by short-term holders since June 2022.
Exchange deposits by bitcoin whales also increased to the highest level since August 2023. Network entities (clusters of addresses) holding at least 1,000 Bitcoin are referred to as whales. However, both long-term holder's exchange transfers and coin days destroyed remained relatively low which implies that the recent profit-taking was mostly focused on short-term holdings/young coins.
We have generally observed a gradual decrease in global crypto hedge fund market exposure since the latest upleg started in October this year. That being said, global crypto hedge fund exposure seems to have started to increase recently, albeit from low levels. We also saw some minor net outflows from global Bitcoin ETPs over the past 2 weeks.
Bitcoin miners have also started to distribute some of their BTC reserves recently as aggregate miner reserves have fallen to the lowest level year-to-date. This seems to be consistent with a significant increase in miner revenues more recently due to a renewed increase in inscriptions.
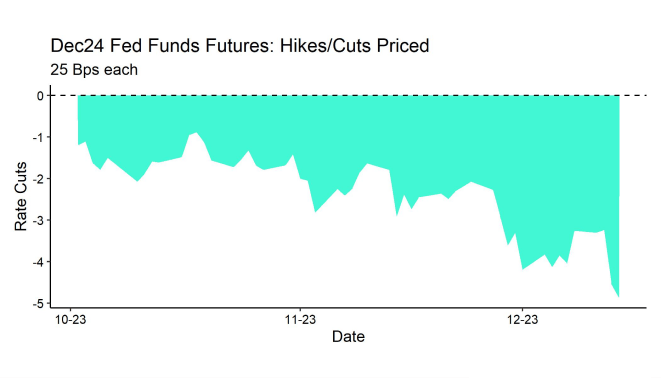
However, the somewhat cloudy crypto market sentiment was stabilized by the recent monetary policy forward guidance of the Fed. Although the Fed kept interest rates unchanged at 5.50% target rate during their latest FOMC meeting, they telegraphed 3 cuts of 25 bps each in 2024 in their most recent Summary of Economic Projections (aka “dot plot”).
This has generally brightened up market sentiment as rates markets have significantly repriced their interest rate expectations for next year. At the time of writing, Fed Funds Futures already price in 5 interest rate cuts until December 2024 (Chart-of-the-Week). This has generally led to an easing of financial conditions by weakening the US Dollar which tends to be a tailwind for Bitcoin and cryptoassets.
The Fed might have backed itself into a corner by officially telegraphing the possibility of rate cuts next year. This may increase medium-term inflation expectations over the coming months which should also be net positive for Bitcoin and cryptoassets.
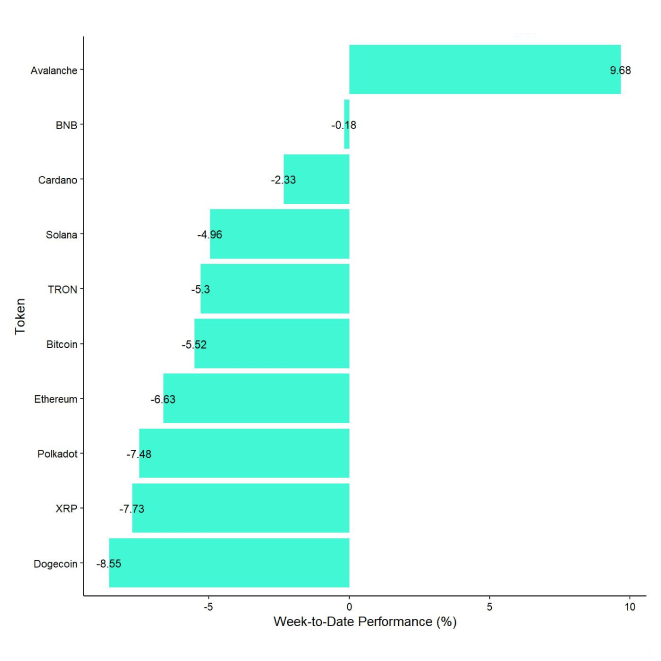
In general, among the top 10 crypto assets, Avalanche, BNB, and Cardano were the relative outperformers.
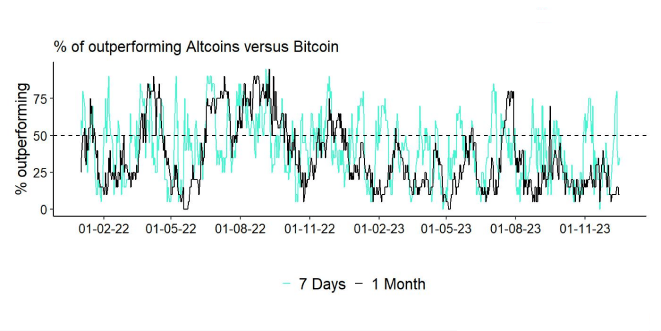
Altcoin outperformance vis-à-vis Bitcoin decreased compared to the week prior, with 35% of our tracked altcoins managing to outperform Bitcoin on a weekly basis.
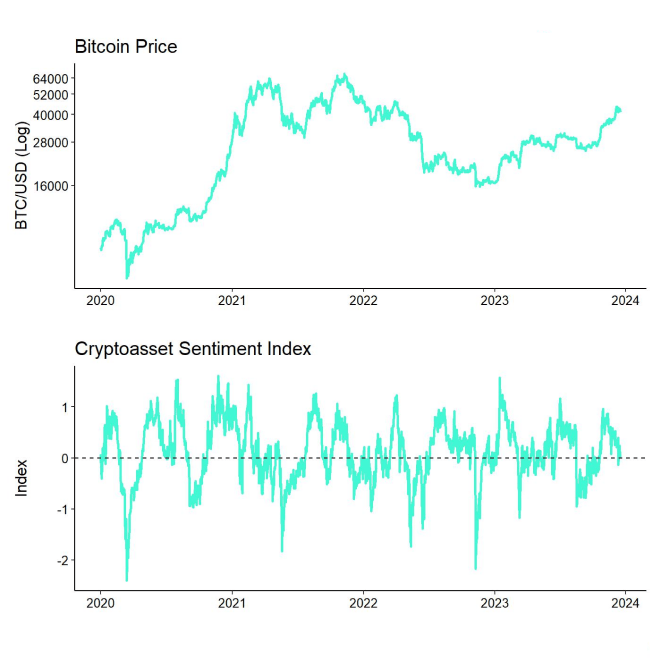
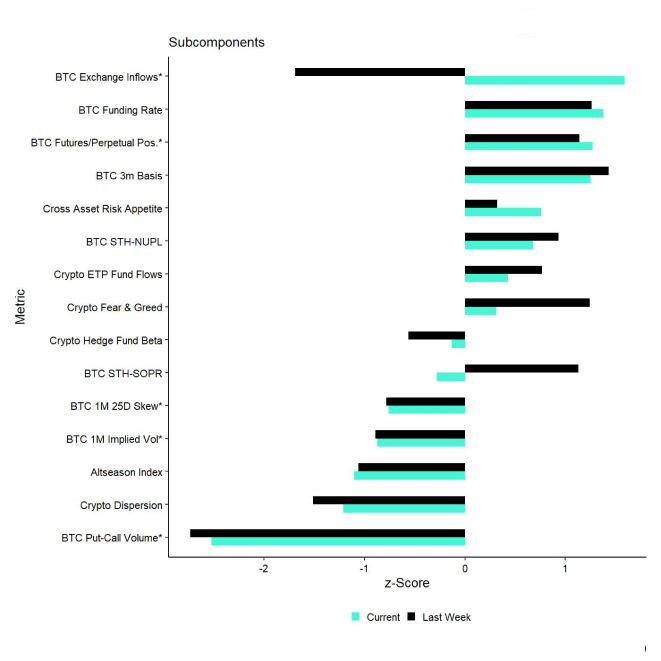
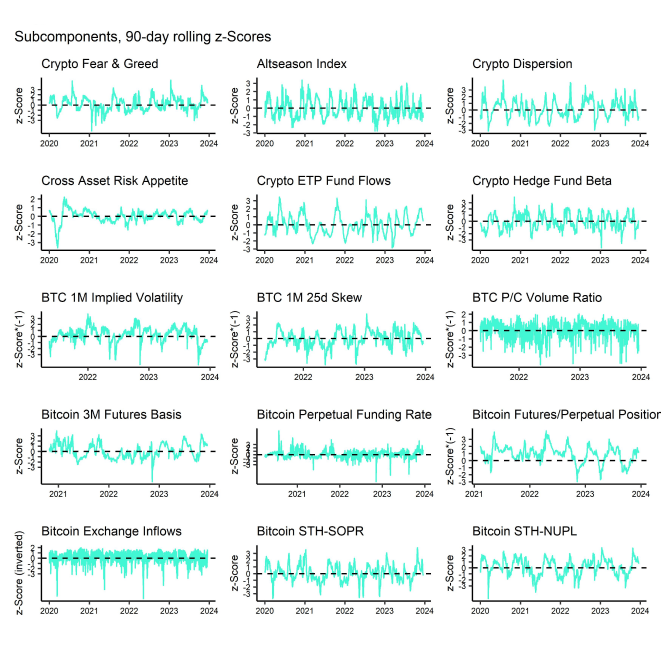
Our in-house Cryptoasset Sentiment Index has stabilized recently and is currently neutral. At the moment, 8 out of 15 indicators are still above their short-term trend.
Compared to last week, we saw major reversals to the upside in Cross Asset Risk Appetite and BTC exchange inflows. Note that adecrease in exchange inflows leads to an increase in Cryptoasset Sentiment within our index.
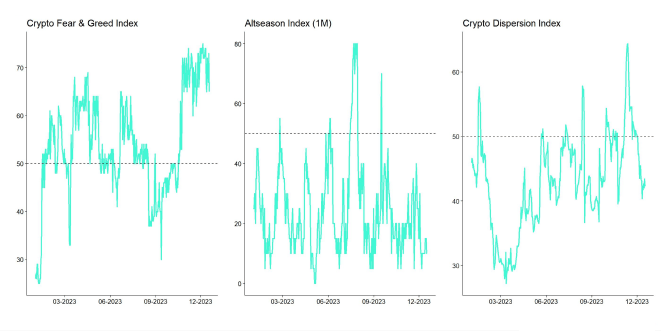
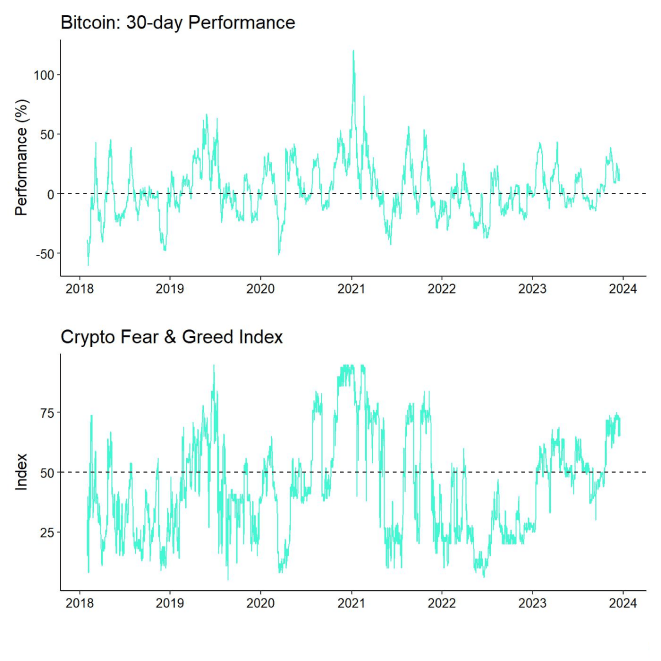
The Crypto Fear & Greed Index still remains in "Greed" territory as of this morning.
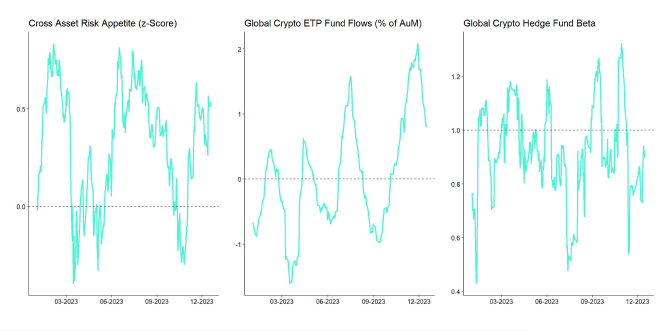
Meanwhile, our own measure of Cross Asset Risk Appetite (CARA) has recently increased, signalling a renewed increase in risk appetite in traditional financial markets. The indicator remains in positive territory overall.
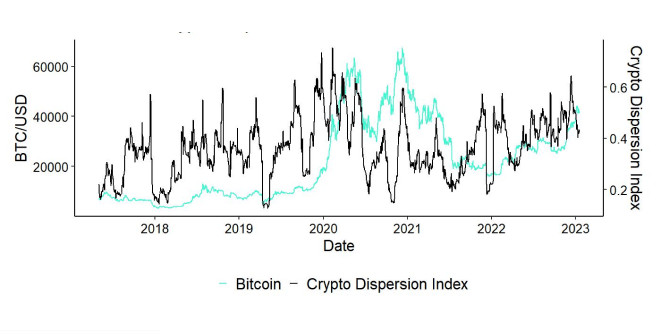
Performance dispersion among cryptoassets has mostly moved sideways last week but continues to be relatively high. In general, high-performance dispersion among cryptoassets implies that correlations among cryptoassets have decreased, which means that cryptoassets are trading more on coin-specific factors and that diversification among cryptoassets is high.
At the same time, altcoin outperformance has declined compared to the week prior, when we saw a pick-up in altcoin outperformance, with 35% of altcoins outperforming Bitcoin on a weekly basis. In general, low altcoin outperformance tends to be a sign of low risk appetite within cryptoasset markets.
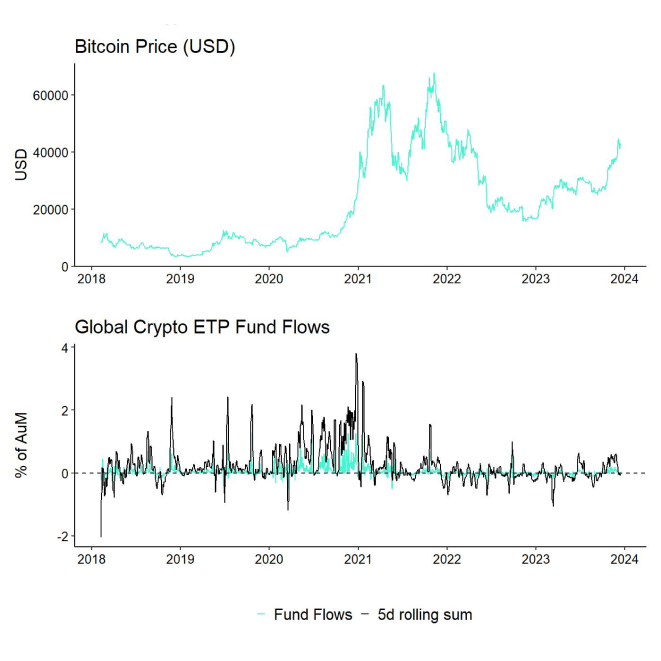
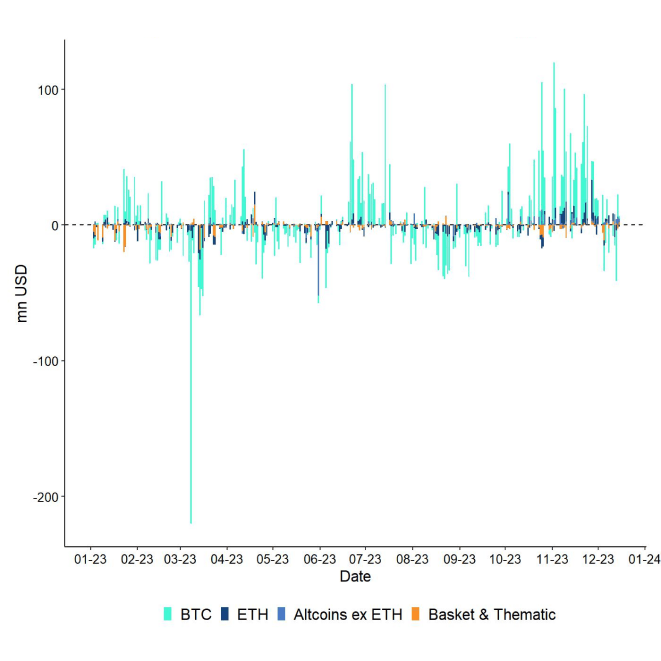
Last week, we saw the second consecutive week of net outflows from cryptoasset ETPs.
In aggregate, we saw net fund outflows in the amount of -18.6 mn USD (week ending Friday).
Most of these outflows focused on Bitcoin ETPs (-33.4 mn USD) and Ethereum ETPs (-8.4 mn USD) while both Altcoin ex ETH ETPs and thematic & basket crypto ETPs managed to attract net inflows of +19.5 mn USD and +3.7 mn USD, respectively, based on our calculations.
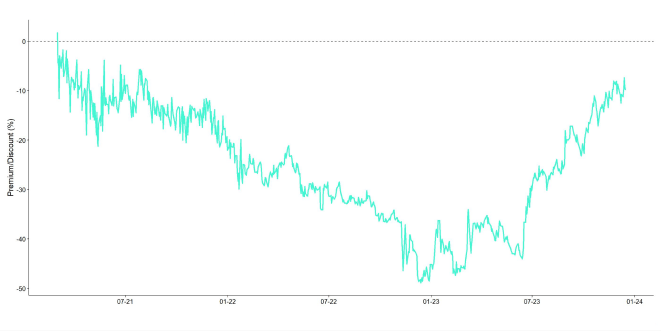
Meanwhile, the NAV discount of the biggest Bitcoin fund in the world - Grayscale Bitcoin Trust (GBTC) – has declined somewhat last week to around -9.9%. In other words, investors are assigning a probability of around 90% that the Trust will ultimately be converted into a Spot Bitcoin ETF.
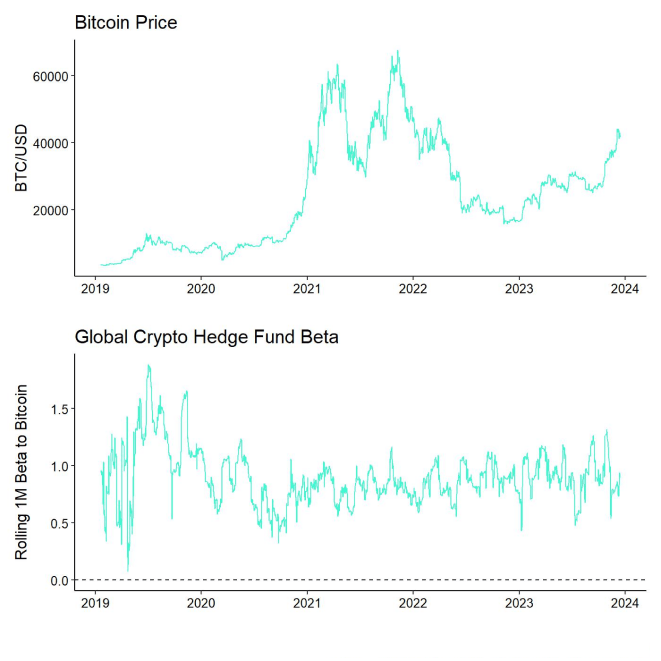
Besides, the beta of global crypto hedge funds to Bitcoin over the last 20 trading remains low at approximately 0.8, implying that global crypto hedge funds still remain under-exposed to Bitcoin market risks. However, global crypto hedge fund exposure seems to have started to increase recently, albeit from low levels.
With the stabilization in market sentiment, we also saw a decline in short-term holder profit-taking last week. Investors are still taking net profits on aggregate though as the realized profit/loss ratio for Bitcoin still remains firmly positive.
This is both true for short-term and long-term holders of Bitcoin, i.e. those investors with a holding period of smaller/greater than 155 days, respectively. Both short-term holder's and longer-term holder's Spent-Output-Profit-Ratio (SOPR) remain above 1 implying that spent coins are predominantly in profit.
However, this also implies that we have not seen a short-term capitulation within this short-term pull-back, yet. Short-term BTC holders still sit on unrealized profits at the current market price of around 41k USD. Short-term holder's aggregate realized price is currently at around 34k USD – this would be the level when short-term holders would be in loss on aggregate and a potential threshold for short-term capitulation if we broke that level to the downside.
On a positive note, we are not observing an increase in older coins being spent, which would be a clear indication of a larger downturn. Neither coin days destroyed (CDD) for BTC nor long-term holder's BTC transfers to exchanges imply that older coins are increasingly on the move. In fact, the percentage of BTC supply last active over 1 year still remains above 70% and therefore close to all-time highs.
Nonetheless, as BTC exchange balances have clearly picked up, we still expect heightened selling pressure in the short term. More specifically, aggregate BTC exchange balances have increased by 34k BTC in December so far, according to data provided by Glassnode. However, this is not the case for Ethereum though where aggregate exchange balances still remain close to their 7-year lows.
Another downside factor is the fact that BTC miners have been distributing some of their BTC reserves lately. In fact, aggregate BTC miner balances have recently reached their lowest level year-to-date. BTC miners have been selling more bitcoins than they have mined over the year, so they have sold parts of their reserves as well.
This behaviour by Bitcoin miners appears to be consistent with the fact that recent miner revenues have spiked due to renewed inscription demand and block space in general. Hash price, which measures the revenue per hash rate, has significantly increased to 125k USD per Exahash – the highest value since July 2021 and back to pre-2020 halving levels.
The remarkable 200% increase in hash rate since July 2021 in competition for the block reward has been countered by the rise in transaction fees. This is mostly related to the still strong demand for inscriptions which have significantly increased fee levels on the Bitcoin blockchain.
Although inscriptions only take up less than 10% of current Bitcoin block space on average, they account for approximately 43% of fees and 67% of all transactions at the moment. Most of these inscriptions are currently related to text/BRC-20 inscriptions.
One of the biggest stories within the BTC derivatives space remains the unfilled price gap in CME Bitcoin futures at around 39k USD. Traders generally expect this CME gap to be filled, i.e. that there is still more downside potential in the short term. Since the inception of Bitcoin CME futures, 29 out of 40 price gaps have been filled so there is a hit rate of around 72.5% that these gaps are being filled.
CME futures price gaps occur on account of the fact that the CME futures exchange is closed over the weekend while spot Bitcoins continue to be traded. As the market opens on Mondays, CME futures prices immediately adapt to the price in the spot market which sometimes creates these price gaps. They are generally a sign of emotional buying which tends to revert itself over time.
This implies that there is still the risk of more downside in the short term.
Meanwhile, aggregate open interest across both BTC futures and perpetuals declined last week, as we saw an increase in futures long liquidations at the beginning of last week. BTC option open interest also declined somewhat.
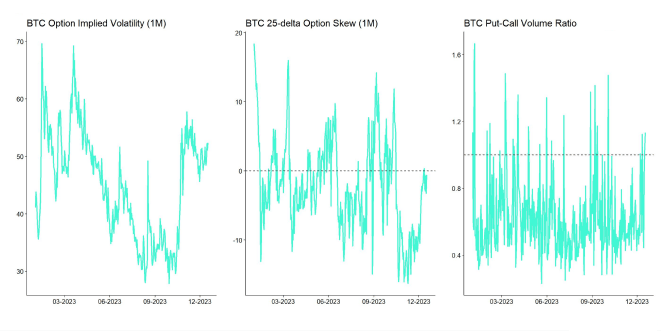
In this context, we continued to see an increase in demand for relative put buying in BTC options. So, option traders continued to increase their downside protection over the past week. However, 25-delta BTC option skews rather moved sideways over the past week. At the time of writing, delta-equivalent calls with 1 month expiry are only 0.5%-points more expensive than puts. Implied volatilities of ATM Bitcoin options generally continued to drift higher over the past week.
At the time of writing, the large majority of BTC call option open interest for contracts expiring at the end of December still sits at 40k USD. The “max pain theory” would suggest that we converge to this price in the short term.
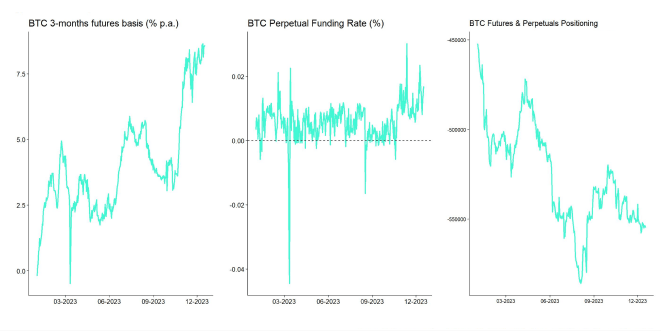
Interestingly, the 3-months annualized rolling basis in BTC futures has continued to increase throughout the week and is currently at the highest level since January 2022 at around 8.5% p.a. according to data provided by Glassnode.
Bitcoin perpetual funding rates also still remain firmly positive across various exchanges, even despite the most recent pull-back as of this morning. So, this implies that the current pull-back is probably not exhausted in terms of selling, yet.
Copyright © 2024 ETC Group. Alle Rechte vorbehalten
WICHTIGER HINWEIS:
Dieser Artikel stellt weder eine Anlageberatung dar, noch bildet er ein Angebot oder eine Aufforderung zum Kauf von Finanzprodukten. Dieser Artikel dient ausschließlich zu allgemeinen Informationszwecken, und es erfolgt weder ausdrücklich noch implizit eine Zusicherung oder Garantie bezüglich der Fairness, Genauigkeit, Vollständigkeit oder Richtigkeit dieses Artikels oder der darin enthaltenen Meinungen. Es wird davon abgeraten, Vertrauen in die Fairness, Genauigkeit, Vollständigkeit oder Richtigkeit dieses Artikels oder der darin enthaltenen Meinungen zu setzen. Beachten Sie bitte, dass es sich bei diesem Artikel weder um eine Anlageberatung handelt noch um ein Angebot oder eine Aufforderung zum Erwerb von Finanzprodukten oder Kryptowerten.
VOR EINER ANLAGE IN KRYPTO ETP SOLLTEN POTENZIELLE ANLEGER FOLGENDES BEACHTEN:
Potenzielle Anleger sollten eine unabhängige Beratung in Anspruch nehmen und die im Basisprospekt und in den endgültigen Bedingungen für die ETPs enthaltenen relevanten Informationen, insbesondere die darin genannten Risikofaktoren, berücksichtigen. Das investierte Kapital ist risikobehaftet und Verluste bis zur Höhe des investierten Betrags sind möglich. Das Produkt unterliegt einem inhärenten Gegenparteirisiko in Bezug auf den Emittenten der ETPs und kann Verluste bis hin zum Totalverlust erleiden, wenn der Emittent seinen vertraglichen Verpflichtungen nicht nachkommt. Die rechtliche Struktur von ETPs entspricht der einer Schuldverschreibung. ETPs werden wie andere Wer
ETC Group bietet erstklassige Produkte für das Investment in digitale Werte wie Kryptowährungen - und das mit Domizil Deutschland. Mit unseren physisch hinterlegten Krypto-ETPs schlagen wir eine Brücke vom klassischen, regulierten Kapitalmarkt in die lebendige Kryptoszene. Unsere ETPs sind der Schlüssel zum Ökosystem der digitalen Vermögenswerte und vereinfachen den Investmentzugang zu Bitcoin, Ethereum und weiteren Kryptowährungen erheblich.
Die ETC Group setzt sich aus einem außergewöhnlichen Team von Finanzdienstleistungsexperten und Unternehmern zusammen, die über Erfahrung mit digitalen Vermögenswerten und regulierten Märkten verfügen. Da Produktqualität und -sicherheit im Mittelpunkt unseres Produktentwicklungsansatzes stehen, ist das Unternehmen bestrebt, kontinuierlich erstklassige börsengehandelte Produkte für institutionelle Kunden auf den Markt zu bringen.
Als Unternehmen hat die ETC Group bereits BTCE auf den Markt gebracht - das weltweit erste börsengehandelte Bitcoin-Produkt mit zentralem Clearing an der Deutschen Börse XETRA, dem größten ETF-Handelsplatz in Europa sowie DA20. Dabei handelt es sich um das weltweit erste Krypto-ETP, das einen MSCI-Index abbildet und einen Schritt in Richtung Investment-Management-Produkte darstellt. DA20 ermöglicht Anlegern ein breites Marktengagement, indem es einen Index von 20 Kryptowährungen abbildet, die etwa 85 % der Kapitalisierung des gesamten Kryptomarktes abdecken.