- Cryptoasset performances were mostly trading to the downside amid ongoing outflows from Grayscale’s Bitcoin Trust (GBTC)
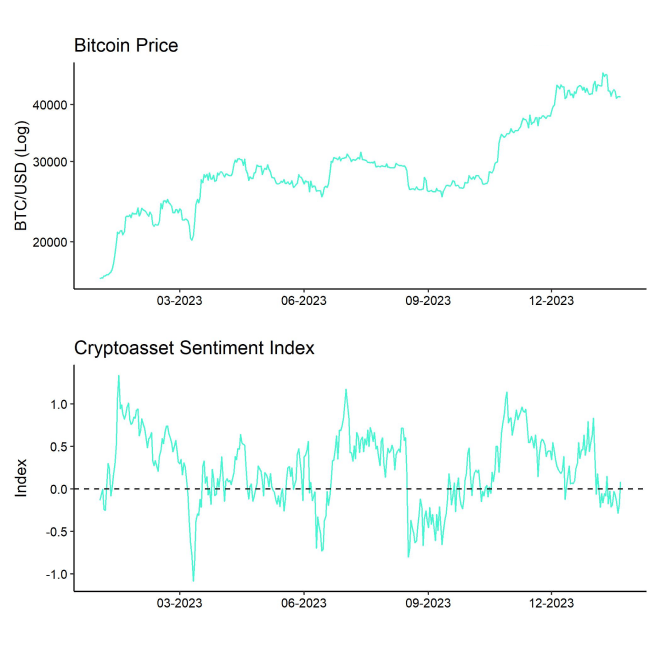
- Our in-house “Cryptoasset Sentiment Index” has declined and is signalling a bearish sentiment
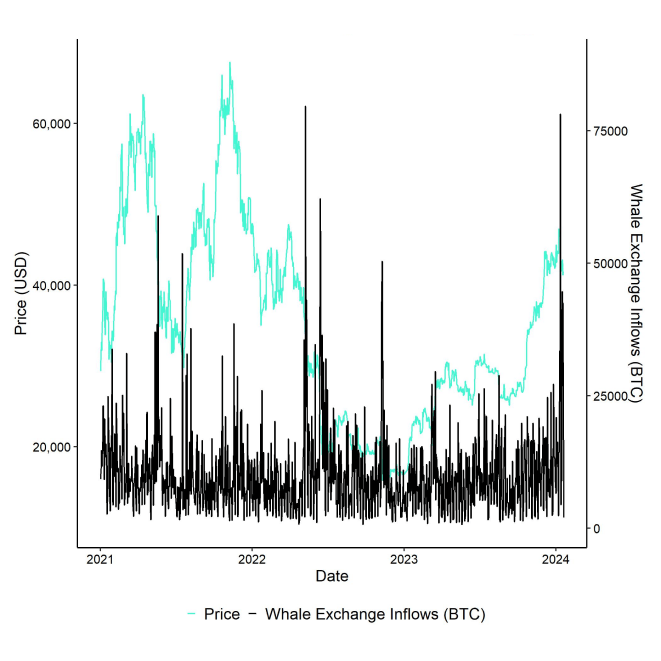
- Prices remained under pressure as BTC whale exchange inflows remained relatively high last week

Chart of the Week
Performance
Last week, cryptoassets were mostly trading to the downside amid ongoing outflows from Grayscale's Bitcoin Trust (GBTC) and heightened whale exchange inflows.
Although overall net inflows into US spot ETFs remained positive throughout last week, GBTC outflows continued unabated which negatively affected market sentiment. The reason is that GBTC's outflows have created a structural increase in supply that is transferred to major bitcoin exchanges like Coinbase.
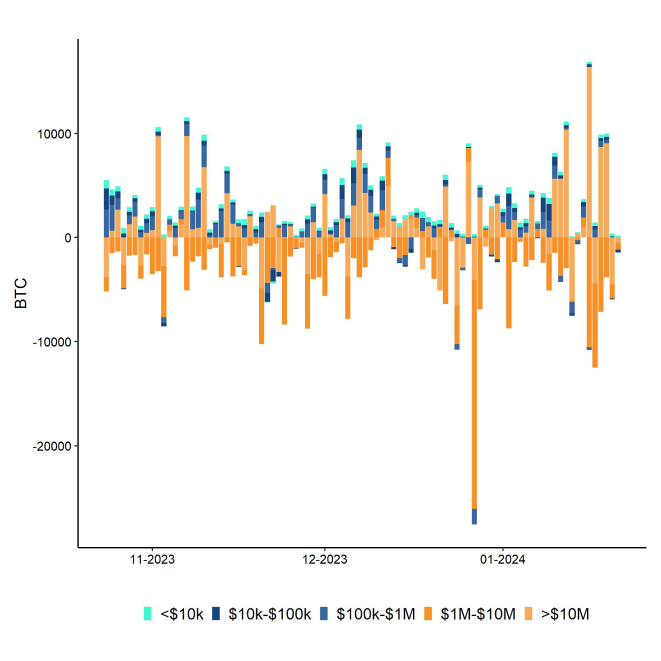
Last week, whale exchange inflows have continued to run at around 19.6k BTC/Day (Monday to Sunday) which is significantly higher than the daily average of only 4.5k BTC/Day average for 2023.
Whales are defined as network entities (cluster of addresses) that hold at least 1,000 BTC.
Our analyses show that Grayscale's outflows have become a significant force in the market and is clearly visible in on-chain crypto exchange data (detailed analysis will follow soon). According to estimations by Glassnode, GBTC has lost approximately -47k BTC last week. Note that this estimation is based on on-chain data. At the time of writing, GBTC remains the biggest Bitcoin fund in the world with approximately 571k BTC in assets-under-management.
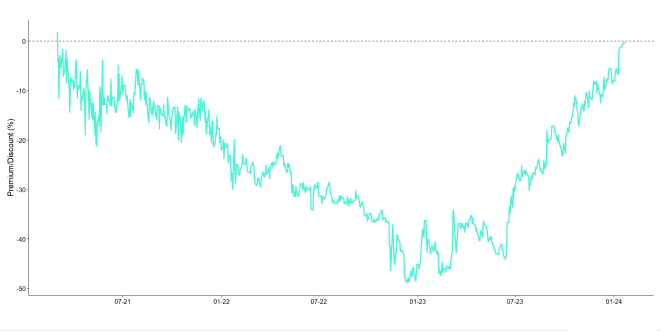
The true reasons behind these GBTC outflows is yet unknown although there are several potential catalysts. One of the reasons could be that earlier investors might now use the opportunity to finally liquidate their shares because the NAV discount has disappeared now that the trust has been converted into an ETF. Especially arbitrageurs could now exit these shares.
Another reason could be related to the fact that fees of other competitor US spot bitcoin ETFs are significantly lower (~25 Bps on average) than for GBTC with 150 Bps. If that were the case, any additional adjustment in GBTC fees would probably stem these outflows and brighten market sentiment again.
Whatever the reason may be, prices will probably stay under pressure in the short-term as long as these GBTC outflows persist. After the US spot ETFs have been approved, the market lacks new positive narratives for some time until we reach the Halving in mid-April this year.
So, the next few months could be more volatile as macro factors such as US growth expectations and monetary policy could come more into focus.
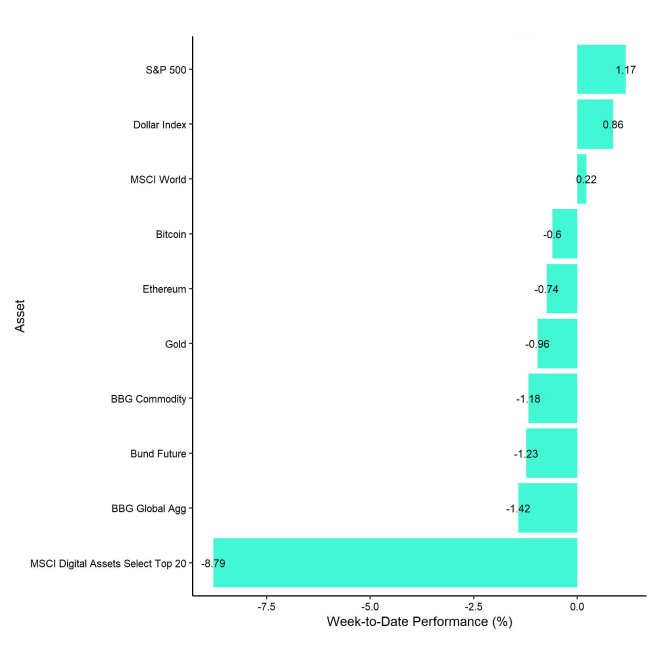
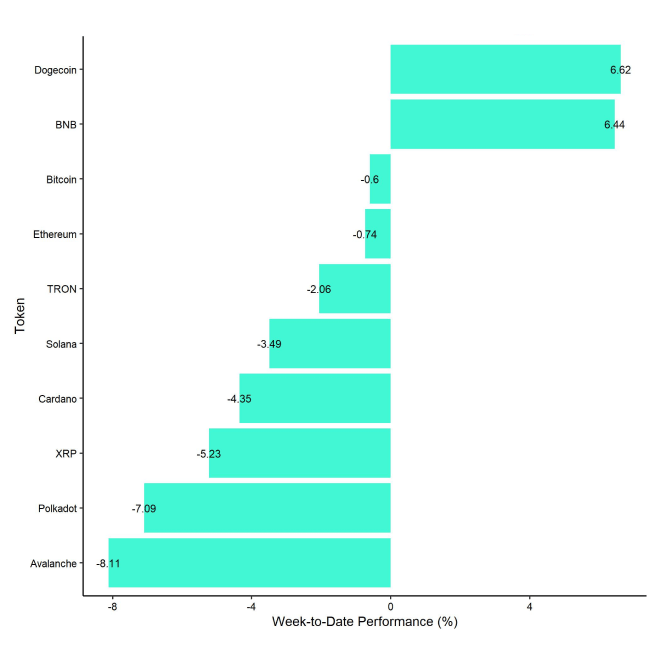
In general, among the top 10 crypto assets, Dogecoin, BNB, and Bitcoin were the relative outperformers.
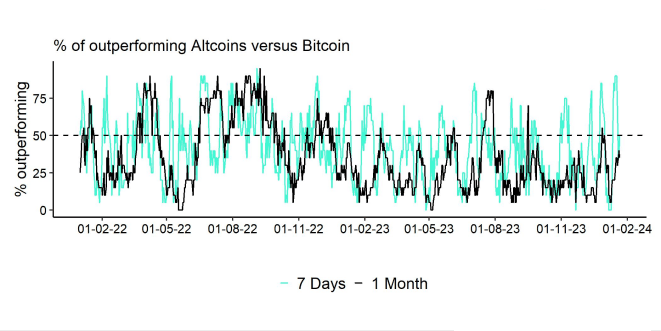
Altcoin outperformance vis-à-vis Bitcoin declined somewhat compared to the week prior, with 50% of our tracked altcoins managing to outperform Bitcoin on a weekly basis.
Sentiment
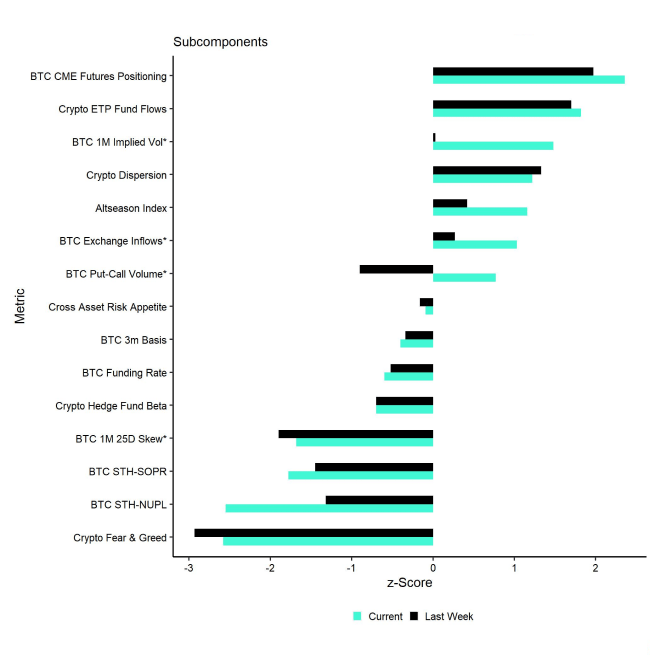
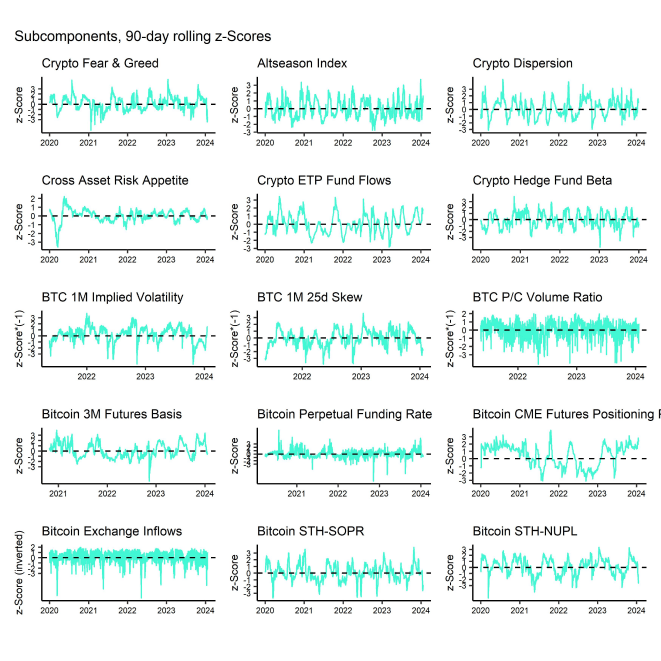
Our in-house Cryptoasset Sentiment Index has recently declined and currently signals a slightly bearish sentiment. At the moment , only 7 out of 15 indicators are above their short-term trend.
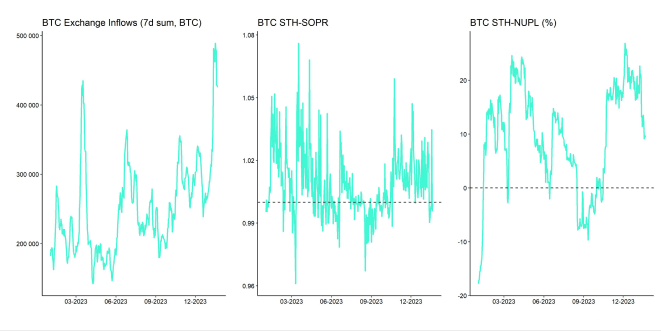
Compared to last week, we saw major reversals to the downside in STH-SOPR and STH-NUPL.
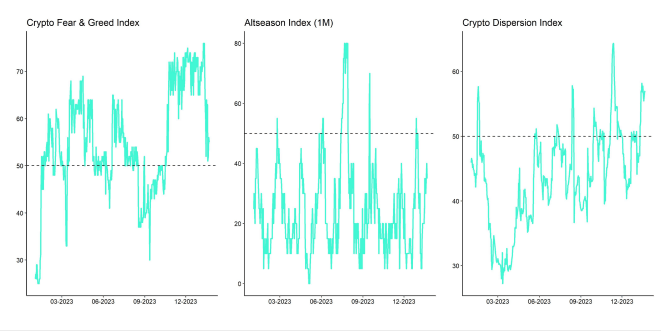
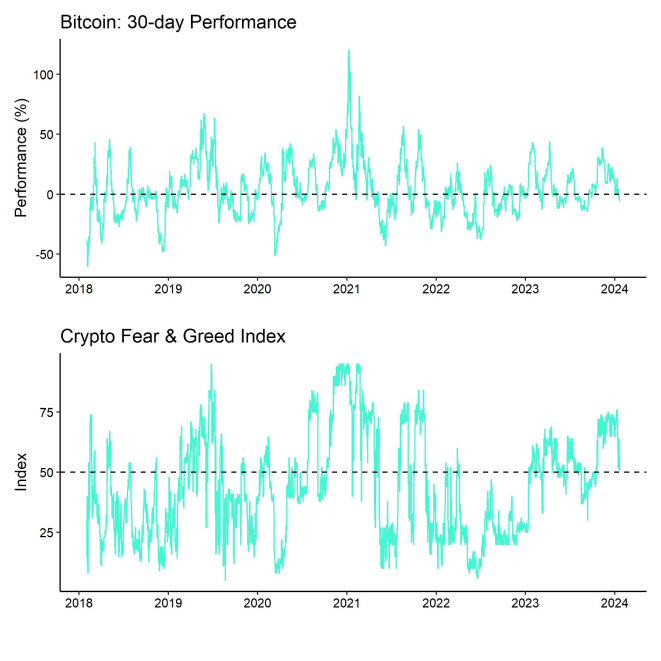
Despite the recent decline, the Crypto Fear & Greed Index still remains in "Greed" territory as of this morning.
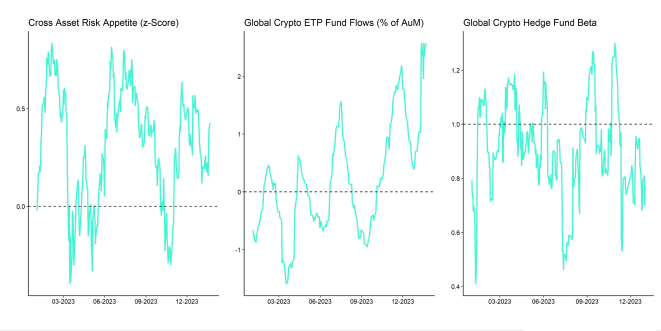
Meanwhile, our own measure of Cross Asset Risk Appetite (CARA) has recently stabilized at lower levels and has increased. Overall, this is signalling a slight increase in risk appetite in traditional financial markets.
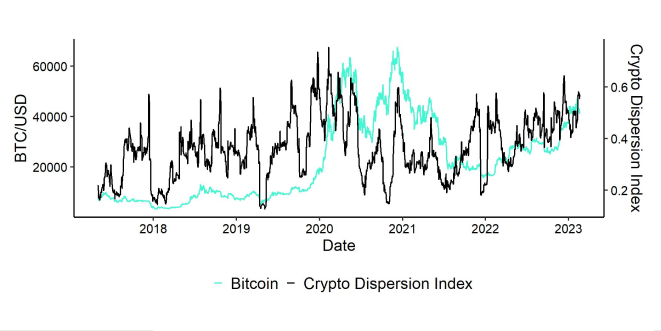
Performance dispersion among cryptoassets has recently remained elevated.
In general, high-performance dispersion among cryptoassets implies that correlations among cryptoassets have decreased, which means that cryptoassets are trading more on coin-specific factors and that diversification among cryptoassets is high.
At the same time, altcoin outperformance vis-à-vis Bitcoin has declined somewhat. 50% of our tracked altcoins have outperformed Bitcoin on a weekly basis.
In general, high altcoin outperformance tends to be a sign of increasing risk appetite within cryptoasset markets.
Fund Flows
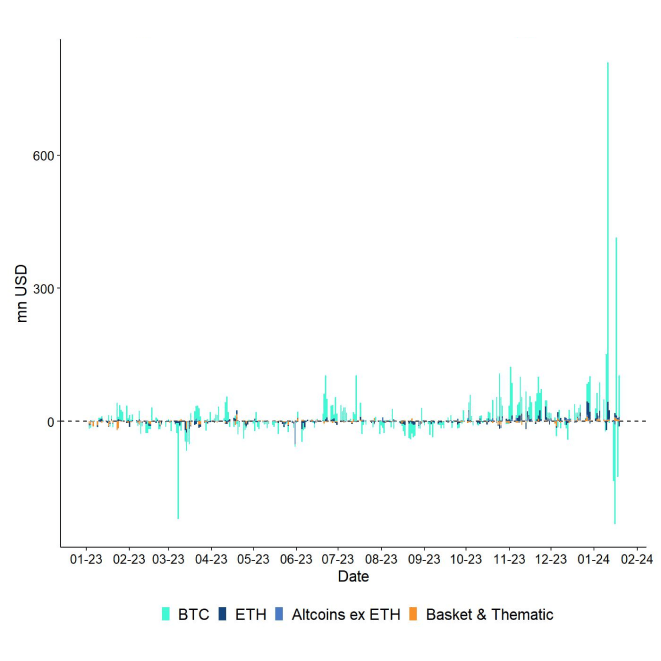
In aggregate, we saw weekly net fund inflows into all types of cryptoassets in the amount of +479.2 mn USD (over the past 4 trading days, week ending Friday) based on Bloomberg data.
Global Bitcoin ETPs managed to attract +463.3 mn USD in net inflows of which +318.6 mn were related to US spot Bitcoin ETFs. Both BlackRock's Bitcoin ETF (IBIT) and Fidelity's Bitcoin Trust (FBTC) have already surpassed the 1 bn USD mark in assets-under-management.
Note that some fund flows data for US major issuers are still lacking in the abovementioned numbers due to T+2 settlement. Also note that we had a shortened trading week in the US because of the Martin Luther King Jr. Memorial Day on Monday last week.
Meanwhile, these positive inflows into US spot Bitcoin ETFs were generally counteracted by continuing net outflows from the Grayscale Bitcoin Trust (GBTC). Over the past week, Grayscale's fund outflows amounted to -2,227.7 mn USD based on data provided by Bloomberg. This was clearly a drag on overall market sentiment last week.
Apart from Bitcoin, we saw comparatively small flows into other cryptoassets last week.
Ethereum ETPs even saw net outflows in the amount of -16.7 mn USD while other altcoin ETPs ex Ethereum managed to attract +15.7 mn USD.
Thematic & basket crypto ETPs also managed to attract net inflows of +16.8 mn USD, based on our calculations.
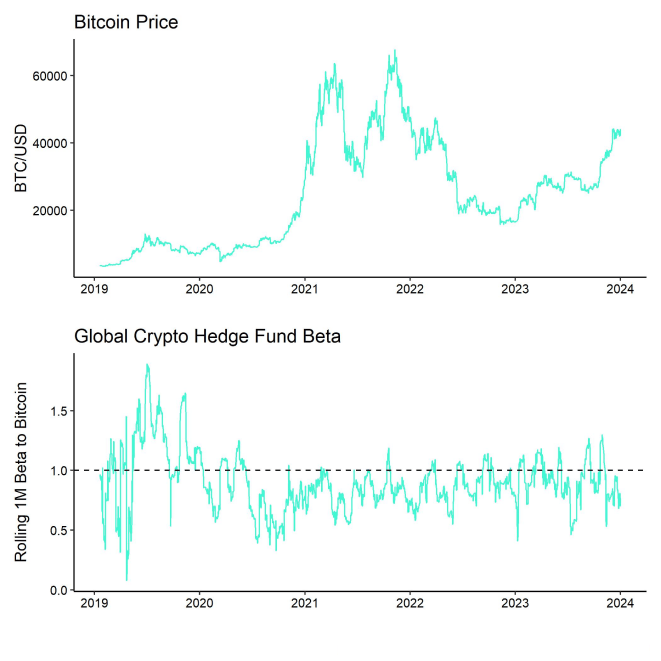
Besides, the beta of global crypto hedge funds to Bitcoin over the last 20 trading still remains low at approximately 0.76, implying that global crypto hedge funds still remain under-exposed to Bitcoin market risks. It appears as if crypto hedge funds are still waiting on the sidelines for new catalysts.
On-Chain Data
A major focus remains the effect of GBTC's outflows on overall exchange supply and liquidity. Last week, overall exchange inflows continued to be relatively high which certainly put a lid on prices.
Especially exchange inflows into Coinbase continued to be significantly high. The majority of these inflows appeared to be from short-term holders and a large part is also being transferred by whales.
Short-term holders are defined as investors with a holding period of less than 155 days. Whales are defined as network entities (cluster of addresses) that hold at least 1,000 BTC.
More specifically, we estimate that around 81% of exchange inflows were conducted by short-term holders last week according to data provided by Glassnode. That being said, we also saw a significant spike in Coin Days Destroyed (CDD) for Bitcoin last week on Tuesday which increased to the highest level since February 2022.
CDD is calculated by taking the number of coins in a transaction and multiplying it by the number of days it has been since those coins were last spent.
A high reading of CDD implies that older coins are on the move which tends to be a bearish signal. In fact, we also saw a significant increase in long-term holder profit-takings last week. Long-term holders exchange transfers of coins in profit spiked to the highest reading since March 2023 which is also a rather bearish signal.
Long-term holders are defined as investors with a holding period of 155 days or more.
Last week, long-term holders realized on average around 90% in profit. However, long-term holders are still sitting on around 50% in unrealized profits and 14.8 mn BTC in supply.
Although long-term holder supply has recently declined from its all-time high in December last year, the recent distribution of coins is still relatively small compared to previous bull cycles. This may pause the recent bull run but it is most-likely not sufficient to reverse the bull market.
Futures, Options & Perpetuals
A key question on the derivatives side is whether GBTC outflows had such a negative impact because APs already had high spot inventories that they hedged via short Futures positions before the launch of the ETFs.
In other words: BTC's spot price was muted due to ETF chain participants holding excess inventory, benefiting from the futures cash-and-carry trade.
Let's consider the following mechanics:
As an Authorized Participant (AP) like Jane Street or JPM, you collect cash from ETF buyers, create shares, and hedge until delivering cash to issuers such as Blackrock.
Your role involves hedging the cash for issuing BTC-tracked shares, ideally stocking up beforehand for market fluctuations.
With the futures curve in contango, you buy BTC, sell futures at a higher price, and secure a cash-and-carry yield. If the ETF isn't approved, you hold until expiry.
Thus, APs and issuers likely entered the ETF launch with significant spot holdings and short futures, impacting spot prices and CME open interest.
When the ETF launches and cash flows in, you hedge the BTC equivalent for the purchased shares. Already owning BTC, you simply remove the hedge.
This approach could explain the limited spot demand as APs and issuers reduce their cash-and-carry inventory.
The impact on the futures market from hedge removal might be obscured by other factors, like leveraged traders adjusting positions or using other methods like options.
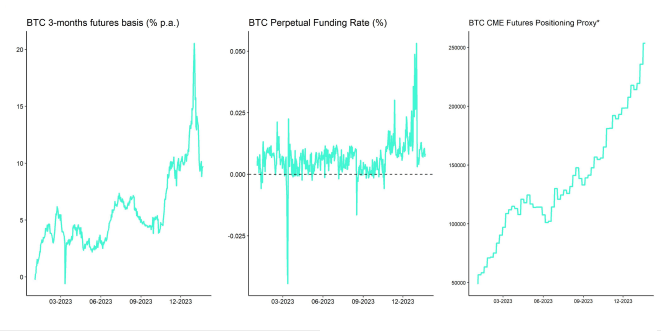
In fact, CME futures open interest has dropped by -566 mn USD (from Monday to Sunday) and long futures liquidations were comparatively small, supporting this theory.
Besides, the 3-months annualized futures basis remained relatively flat and even increased slightly (ie slight steepening of the futures contango) throughout the week which also supports this theory since buying back the futures contract could have exerted upward pressure on the futures curve and the basis.
At the time of writing, the 3-months annualized basis for Bitcoin stands at 9.7% p.a.
Meanwhile, futures-based ETFs like ProShares Bitcoin Strategy ETF (BITO) experienced net inflows last week which rather implies net buying of underlying futures and does not explain the reduction in CME futures open interest either.
Apart from Bitcoin futures, perpetual open interest was relatively unchanged throughout the week as was option open interest.
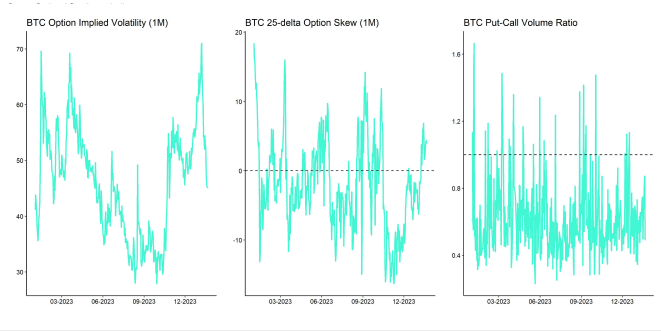
Implied volatilities continued to decline from the very high levels we have seen the week prior. At the time of writing ,1-week BTC option volatility stands at 47.4% compared to 87.7% prior to the ETF approvals. Short-term option skews have also declined but remain relatively elevated implying that downside protections remain well-bid.
However, BTC put-call open interest ratios have normalized and are near multi-year lows. We have only seen an outsized demand for puts on Saturday this weekend with relative put-call volumes reaching a ratio of 0.87 but ratios below 1 are not significantly high.
Bottom Line
- Cryptoasset performances were mostly trading to the downside amid ongoing outflows from Grayscale’s Bitcoin Trust (GBTC)
- Our in-house “Cryptoasset Sentiment Index” has declined and is signalling a bearish sentiment
- Prices remained under pressure as BTC whale exchange inflows remained relatively high last week
Appendix
Copyright © 2024 ETC Group. Alle Rechte vorbehalten


