- Performance: In July, cryptoassets rebounded from oversold levels, with Bitcoin outperforming traditional assets amid potential Fed rate cuts, while Ethereum underperformed due to Grayscale outflows.
- Macro: Worsening US economic and labour market conditions support imminent Fed rate cuts, which, despite short-term challenges for Bitcoin, could ultimately benefit it due to positive political developments and reduced correlation with traditional assets.
- On-Chain: July saw a tactical Bitcoin price bottom due to seller exhaustion, improved market conditions, and political support, suggesting potential for renewed retail participation and a sustained bull cycle, bolstered by the positive impact of the Bitcoin Halving event.
Chart of the Month
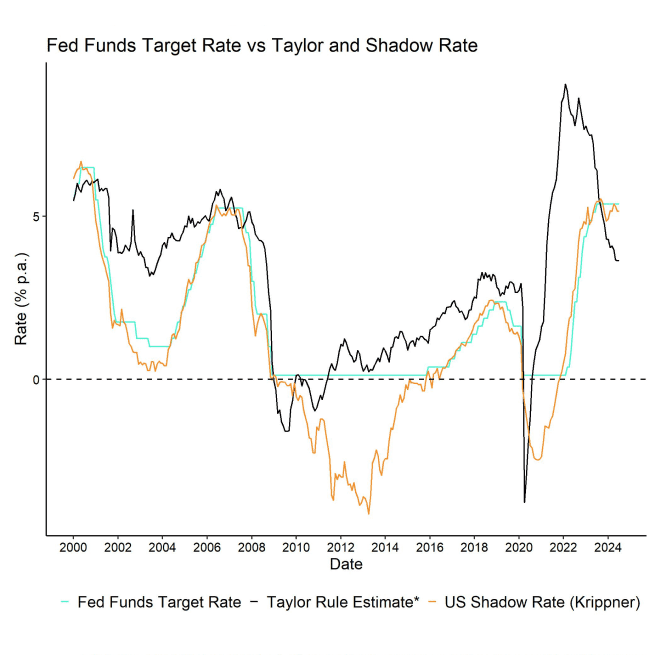
*Taylor Rule uses standard coefficients (0.5) and considers both NAIRU estimate and L&W natural rate estimate
Performance
July was characterized by a general recovery in cryptoasset prices from bearish sentiment and oversold levels. The completion of the German government bitcoin sales which coincided with a pronounced BTC miner capitulation and other factors at the beginning of July, formed the basis for a more sustained recovery last month as sellers became increasingly exhausted.
As a result, cryptoassets outperformed traditional assets like equities in July:
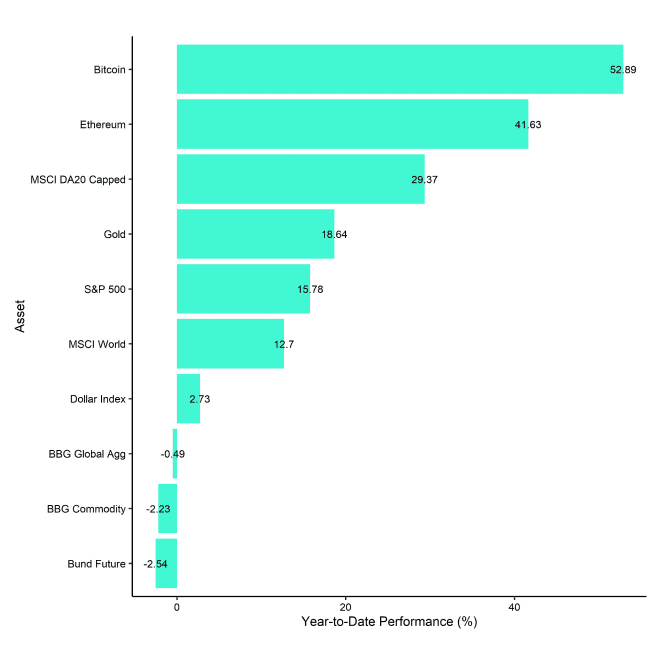

Moreover, Ethereum spot ETFs debuted on the 23 rd of July in the US. Because of aggregate net outflows from these ETFs, Ethereum significantly underperformed Bitcoin in July. However, this was mainly due to large outflows from Grayscale's flagship Ethereum Trust (ETHE) while all other new ETFs saw positive net inflows.
We expect these net outflows from ETHE to gradually decelerate over time like the flow pattern we have observed after the Bitcoin ETF trading launch with outflows from the Grayscale Bitcoin Trust (GBTC). Thus, selling pressure on Ethereum via this channel should gradually recede. In fact, more recent US ETF flow data already suggest that net outflows from ETHE have been decelerating.
Another major event was Trump's speech at the Bitcoin conference in Nashville on the 27 th of July where he amongst other things presented plans to implement Bitcoin as a strategic reserve asset, if elected as president. This led to a short rallye in bitcoin towards 70k USD but the market has given up all gains since this speech implying that a positive speech was largely anticipated.
From a pure performance perspective, a Trump victory still appears to be the preferred election outcome for cryptoasset markets which is also supported by the fact that cryptoasset performances have been positively correlated with Trump's election odds and the fact that large crypto donors mostly supported Trump's campaign so far.
That is one of the reasons why any election promises will be highly dependent on the future development of these election polls/odds. We expect cryptoasset markets to become more sensitive to these election polls/odds as we approach the November 5th election date (and we will also publish a specific research piece on this topic in due course).
On the macro side, another major event was the Crowdstrike incident that led to widespread global IT outages and price corrections in traditional financial markets due to heightened uncertainty. However, Bitcoin and other cryptoassets were buoyed by these developments which led to a short-term performance decoupling between cryptoassets and equities. This performance decoupling has somewhat continued as major equity indices were weighed down by increasing US recession risks as well.
In fact, we see an increasing probability for a performance decoupling between cryptoassets and equities over the coming months, as the lagged positive effects from the Bitcoin Halving and favourable political developments in the US could support cryptoassets regardless of increasing US recession risks.
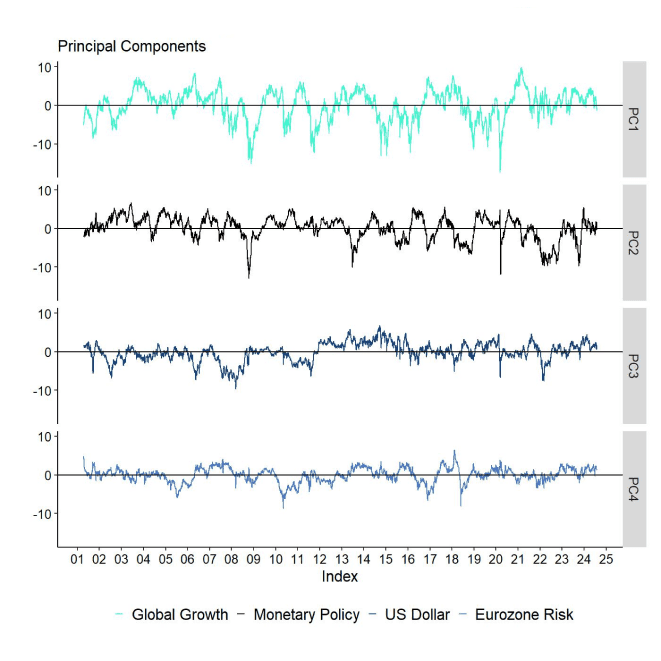
This is also supported by our quantitative macro model that suggests that the % of bitcoin's performance variation explained by coin-specific factors unrelated to macro has been gradually increasing.
Moreover, although the FOMC left interest rates unchanged during the latest meeting yesterday, we think that there is an increasing probability of Fed rate cuts in September as US economic data like inflation and unemployment will most-likely continue to deteriorate.
A standard Taylor rule already suggests that the Fed is “behind the curve” and that multiple rate cuts are already warranted (Chart-of-the-month). This is also reflected in Fed Funds Futures which price a 100% probability for a 25 bps cut in September.
Reductions in interest rates tend to be bullish for scarce assets like Bitcoin since these periods are usually associated with a weakening US Dollar and increasing macro liquidity.
A closer look at our product performances also reveals that cryptoassets have mostly performed positively in July but with a large performance dispersion among cryptoassets due to the underperformance of Ethereum and other altcoins vis-à-vis Bitcoin. That being said, XRP and Solana significantly outperformed both Bitcoin and Ethereum in July:
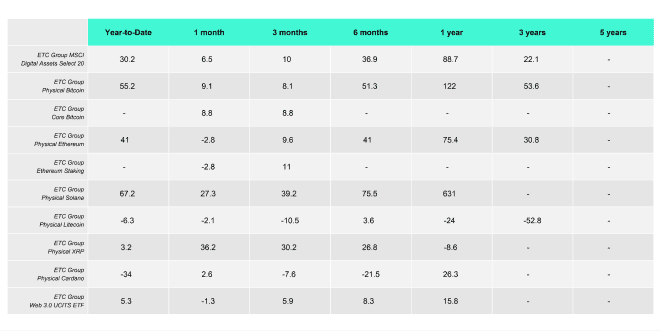
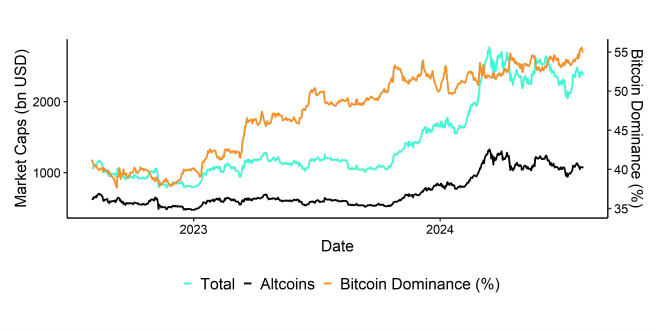
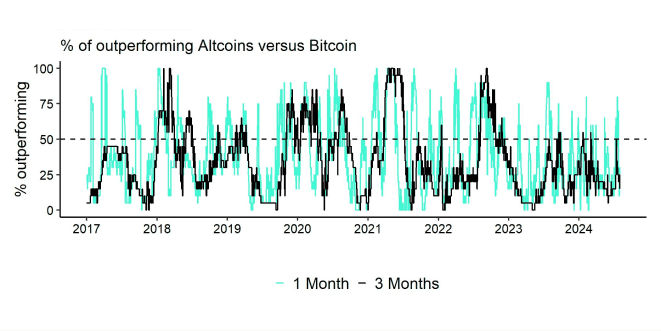
That being said, altcoins generally underperformed Bitcoin in July. Based on our “Altseason Index”, only 25% of our tracked altcoins managed to outperform Bitcoin on a monthly basis. Low altcoin outperformance generally tends to be sign of low risk appetite within cryptoasset markets. Performance dispersion among cryptoassets also remains relatively low suggesting that most altcoins tend to be highly correlated with the performance of Bitcoin.
Bottom Line: In July, cryptoassets recovered from oversold levels, with Bitcoin outperforming traditional assets and Ethereum lagging due to large outflows from Grayscale's Ethereum Trust. Political developments and the potential for Fed rate cuts in September could further support Bitcoin, while altcoins generally underperformed, indicating low risk appetite in the crypto market.
Macro Environment
The overall growth outlook in the US has continued to worsen over the past weeks, especially the situation in the housing market. We think that this has generally strengthened the case for even earlier rate cuts by the Fed.
A standard Taylor Rule estimate based on core PCE inflation and the U3 unemployment rate already suggests a Fed Funds Target Rate of only 3.5% compared to a mid-point target rate of 5.125%.

*Taylor Rule uses standard coefficients (0.5) and considers both NAIRU estimate and L&W natural rate estimate
So, despite the fact that the FOMC left interest rates unchanged at their latest meeting yesterday, overall economic conditions already warrant rate cuts by the Fed.
In general, we think that economic data will continue to strengthen the case for Fed rate cuts in September.
For one, high-frequency inflation indicators are pointing towards a further deceleration in US inflation rates. At the time of writing, Truflation reports a headline inflation rate of only 1.5% which is significantly lower than the latest official number of 3.0% reported by the US government for June 2024.
Furthermore, leading indicators for the US labour market such as the ISM Manufacturing and Services Employment sub-indices continue to signal worsening labour market conditions. The same observation is echoed by the Labor Market Conditions Index compiled by the Kansas City Fed.
The daily LinkUp 10,000 index which measures job openings at the 10,000 biggest companies in the US also continues to decline. The risk is that quits and layoffs won't be absorbed by current job openings as quickly as at the beginning of the year which could lead to a built-up of unemployed work force, i.e. an increase in the unemployment rate.
This seems to be corroborated by the fact that initial unemployment claims – another leading indicator for US unemployment – has been trending higher since the beginning of the year. Unemployment claims have increased to 240k, up from 190k at the beginning of the year.
At the time of writing, the Fed Funds Futures market prices a 100% probability of a 25 bps reduction in the Fed Funds Target Rate.
The probability for cuts has recently increased due to the recent stock market woes and has also been bolstered by increasingly dovish forward guidance from Fed officials. Fed chairman Powell himself yesterday suggested that a reduction in the Fed's policy rate could be on the table as soon as the next meeting in September.
This is also reflected in the recent re-steepening of the US yield curve. At the time of writing, the US yield curve in terms of the 2s10s term spread is just 22 bps away from becoming positive again.
The reason why that is relevant is that the US yield curve tends to steepen in anticipation of Fed rate cuts.
This tends to be bullish for Bitcoin and cryptoassets since Fed rate cuts are synonymous with an increase in macro liquidity as outlined in our previous report on the turning liquidity tide.
In this context, the re-steepening of the US yield curve tends to be a clear signal for imminent Fed rate cuts.
This is also shown in the following chart which shows the evolution of the Fed Funds Target Rate around historical re-steepenings of the US Treasury 2s10s term spread since 1977:
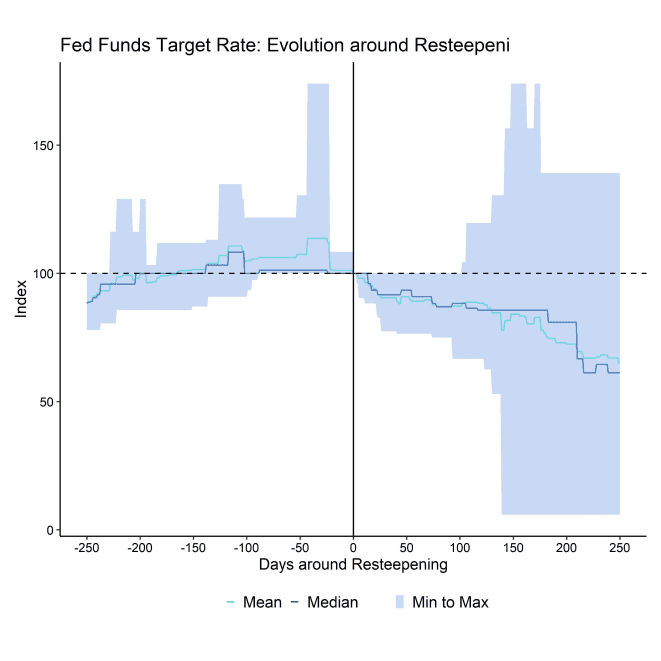
Results based on the previous 2s10s UST yield resteepenings since 1977
The issue is that this resteepening tends to coincide with a sharp deterioration in labour market conditions and economic growth and ultimately signals the start of the recession.
From a pure quantitative perspective Bitcoin continues to be dominated by changes in global growth expectations. So, we still expect this deterioration in US and global growth expectations to be net negative for Bitcoin in the short term.
The good news is that residual/unexplained factors have been increasing in statistical relevance for Bitcoin more recently as evidenced by the increase in the residual variable in our macro factor regression:
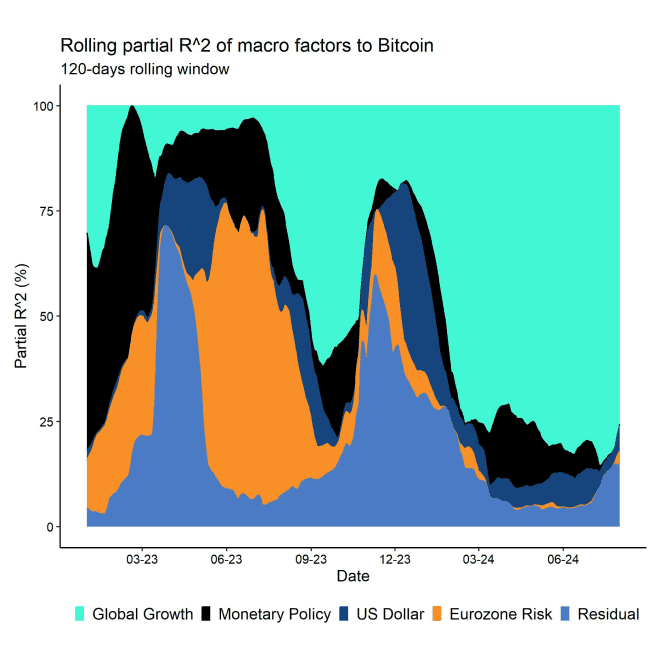
This implies an increasing potential for performance decoupling between Bitcoin and traditional financial assets that could be more affected by this likely deterioration in global growth expectations.
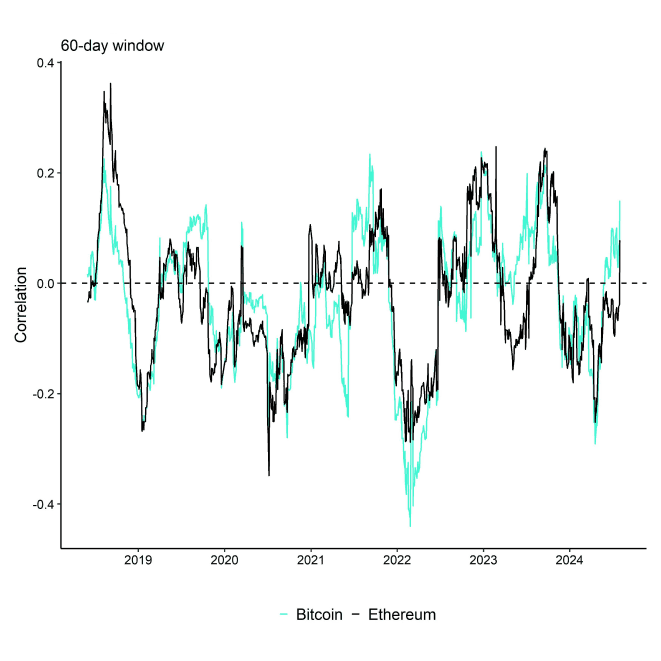
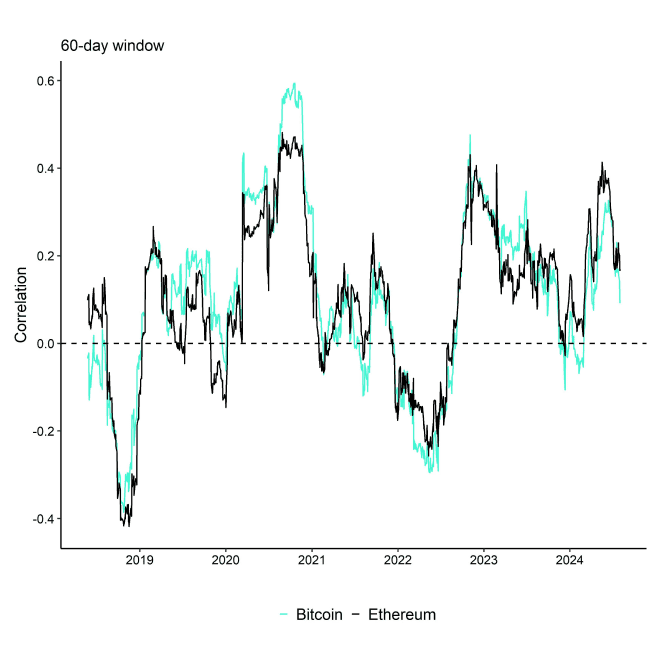
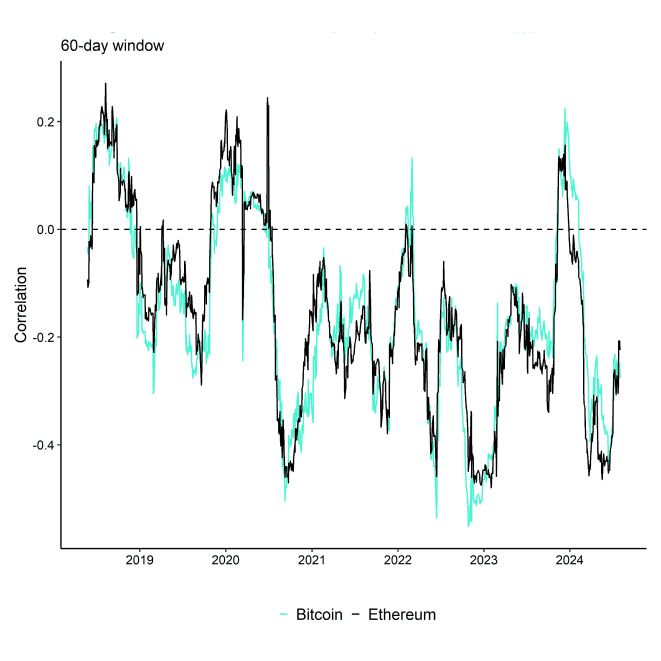
This observation is also supported by the recent decline in correlations between major cryptoassets and the S&P 500:
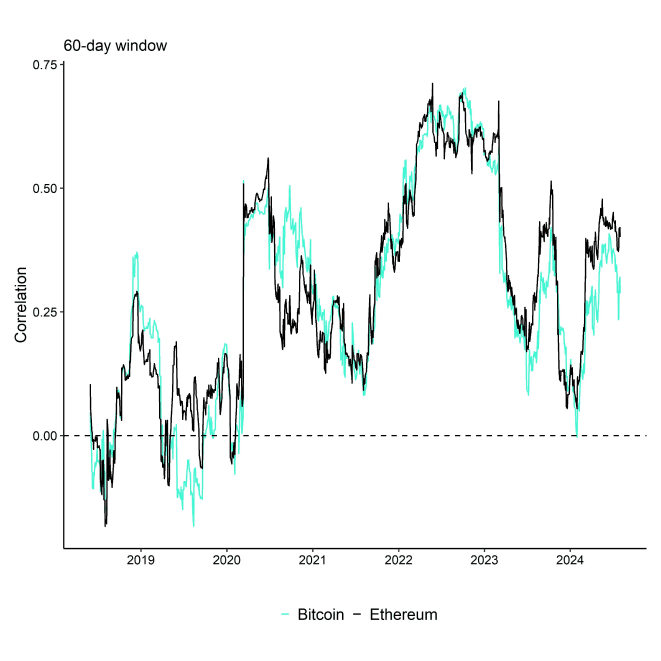
The recent decline in correlations is mostly due to the global IT outages related to the erroneous Crowdstrike software update that pressured traditional assets and buoyed decentralised cryptoassets like Bitcoin as reported here.
In this context, we think that Bitcoin could serve as a pristine hedge against an increase in geopolitical risks as analysed in one of our latest reports.
In any case, we still expect that a further repricing of global growth expectations to the downside could be a short-term headwind for Bitcoin and cryptoassets but also see an increasingly strong tailwind from the ensuing turnaround in Fed monetary policy.
Investors should watch for a resteepening of the US yield curve for an early signal of imminent Fed rate cuts.
Another very important development was the Bitcoin conference in Nashville over the past weekend, that saw major announcements by US politicians.
Presidential candidate Trump delivered a pro-Bitcoin speech on Saturday at the world's largest Bitcoin conference in Nashville where he amongst other things announced plans to add Bitcoin as a strategic reserve asset, if elected as president.
This was echoed by Wyoming senator Cynthia Lummis who officially presented the “Bitcoin Reserve Bill” to live conference participants as well.
Trump made many other very positive promises as outlined in our latest weekly report here.
The fact that influential politicians are actively catering to cryptoasset investors is probably just a symptom of the fact that cryptoasset adoption rates in the US but also globally have reached a critical mass as highlighted in one of our recent reports.
In fact, we might witness what is commonly referred to as “Hyperbitcoinization” over the coming years since US adoption rates are already at the inflection point from “early adopters” to the “early majority” where adoption starts to accelerate.
The latest announcement by a second state pension fund (of Jersey City) to include Bitcoin in its long-term strategic asset allocation speaks volumes in this regard.
Bottom Line: The deteriorating US economic conditions, particularly in the housing market, and worsening labor market indicators support the case for the Fed to cut rates soon, likely by September. Despite short-term headwinds for Bitcoin due to declining global growth expectations, positive political developments and reduced correlation with traditional assets suggest a potential for Bitcoin to serve as a hedge and benefit from anticipated Fed rate cuts.
On-Chain Developments
July can generally be described as a month that saw increasing seller exhaustion with subsequent recovery. Most notably, the German government completed its sales of around 50k BTC which coincidentally marked the point of max selling pressure at the beginning of July.
There was generally wide-spread capitulation as outlined here which made a tactical bottom in price very likely.
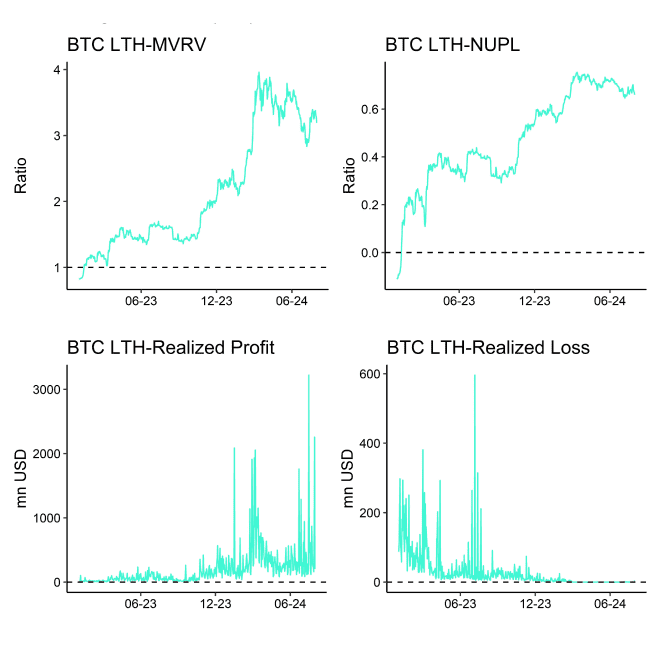
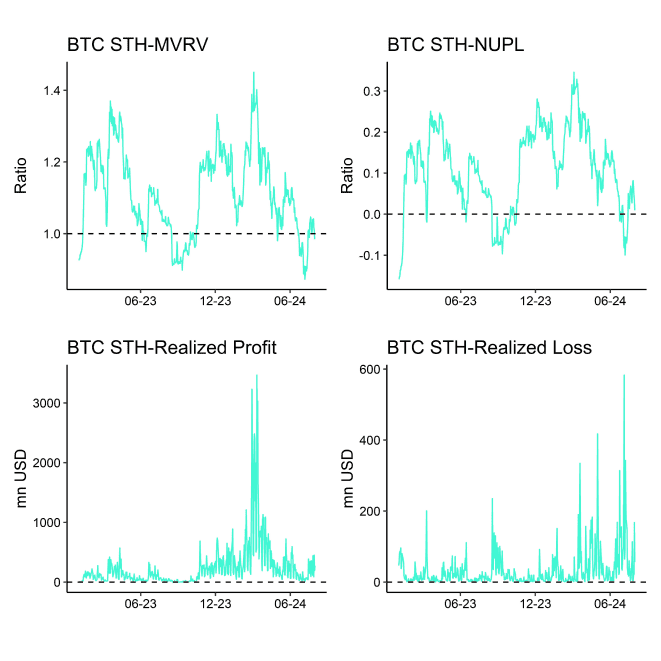
In general, both long-term holder (LTH) profit-taking as well as short-term realized losses have declined significantly since the beginning of July.
The spike in LTH realized profits was largely due to German government sales while the spike in STH realized losses was largely due to a capitulation by whales which exacerbated the sell-off in July but also established the basis for a more sustainable tactical bottom.
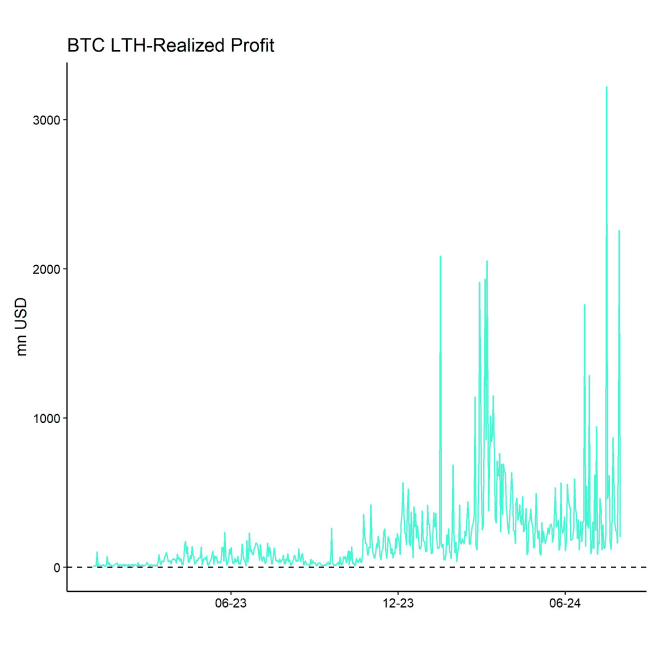
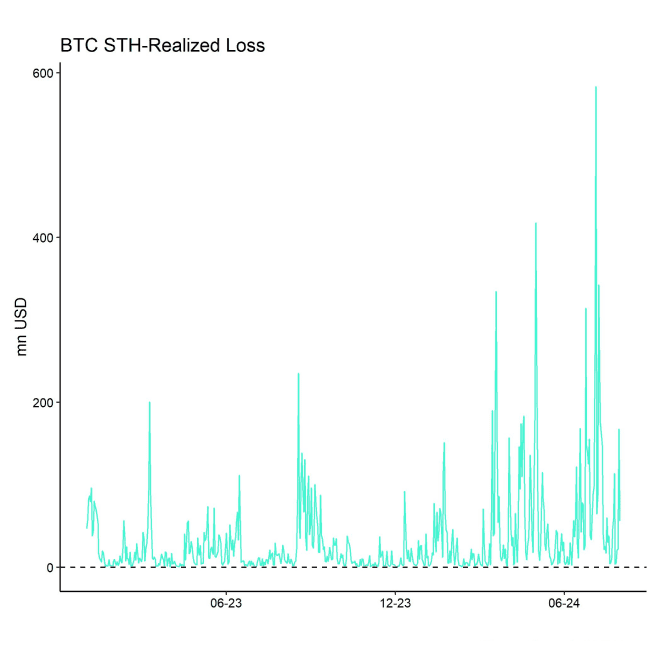
Note that short-term holders (long-term holders) in this context are defined as network entities that hold Bitcoin for less (more) than 155 days based on the methodology by Glassnode.
Since then, we have seen a gradual return in risk appetite as evidenced by increasing global Bitcoin ETP flows and an increasing market beta of global crypto hedge funds as mentioned in one of our recent weekly reports.
Other large long-term holders such as the Mt Gox trustee also redistributed their bitcoins to the original creditors in July but with little market impact so far which is a positive sign.
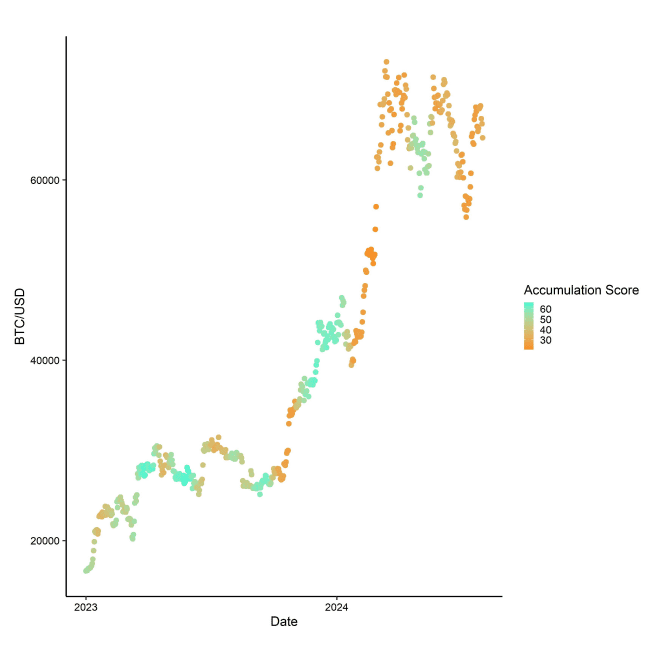
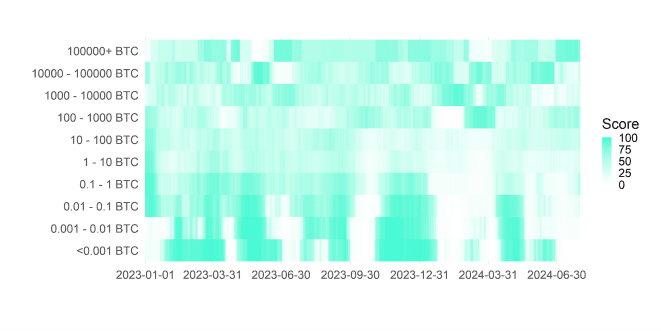
That being said, average accumulation activity across all wallet cohorts have been mediocre at best but there are early signs of a renewed increase in accumulation, led by very large (+100k BTC) and mid-sized wallet cohorts.
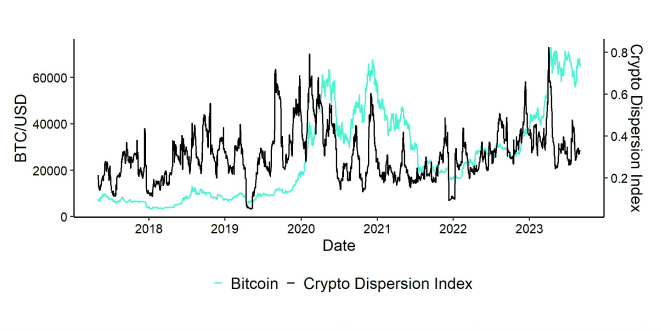
Meanwhile, some selling pressure in July also emanated from BTC miners who sold approximately 125% of their mined supply during the month of July, i.e. sold into their BTC reserves as well. However, this was also due to the fact that blocks were mined significantly faster than 10 minutes which led to a sharp upward difficulty adjustment as well.
On the bright side, the aggregate Bitcoin hash rate has reached a new all-time high in July, implying decreasing economic pressure on BTC miners. The hash ribbon indicator has also flashed a positive signal in mid-July. Therefore, we expect selling pressure by BTC miners also to decrease over the coming months which should provide an additional tailwind for Bitcoin.
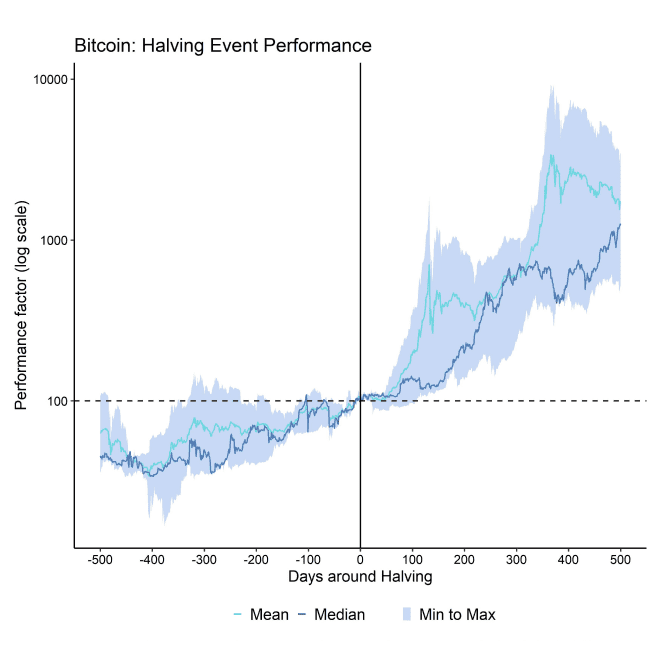
In this context, it is also important to highlight that we have just passed 100 days after the Halving event that happened on the 20 th of April 2024.
Based on one of our previous analyses, we expect the Having effect now to become increasingly important for Bitcoin's performance over the next 300 days (until around May 2025), i.e. 400 days after the original Halving event.
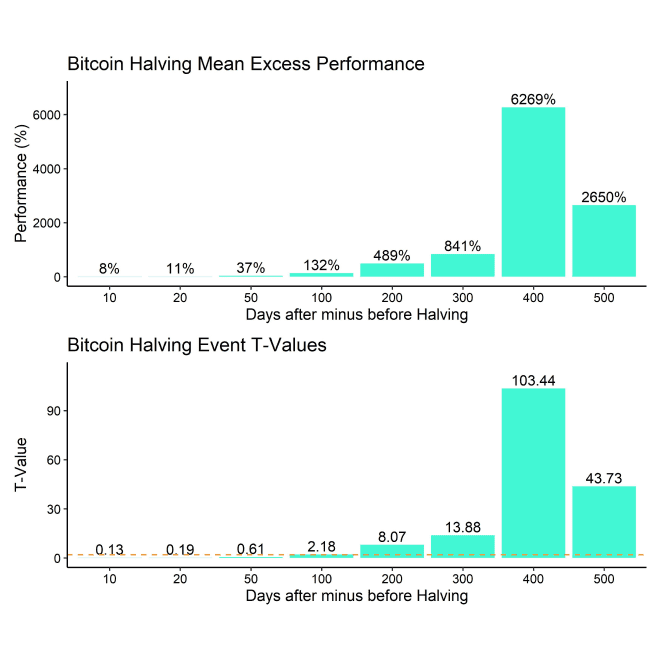
Mean Excess Performance = difference between performance X days after minus X days before the Halving
Orange dashed line denotes 95% level of confidence
We think that the recent announcement by Trump and other politicians could serve as a powerful catalyst to support the fundamental tailwind induced by the Bitcoin Halving.
A renewed increase in retail participation would be an important signal for a sustainable continuation of the bull cycle. The latest political developments could actually induce a return of broader retail participation.
In fact, the SLRV Ribbons signal that retail participation seems to have increased lately. SLRV ratio measures the ratio between short- to long-term realized value, i.e. the value transacted by short-term holders (24h holding period) and long-term holders (6-12 months holding period).
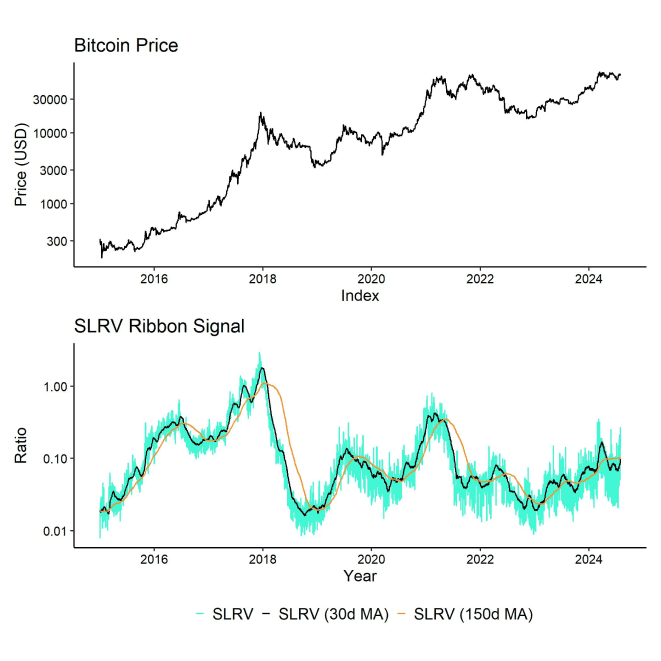
An increase in this ratio implies an increasing share of short-term transactional value and capital invested which is a sign of retail participation.
We think that this is a necessary condition for a sustained bull cycle and the recent announcements by Trump and others could serve as an important harbinger for that. In fact, we have seen a pick-up in Google search queries for “bitcoin” around Trump's speech at the Bitcoin conference which indicates increasing retail interest in the subject.
Another positive sign is the fact that the market seems to have digested a large part of the “legacy supply” overhang (GBTC outflows, Mt Gox distribution, government entity sales, BTC miner distribution) with positive market implications in terms of declining selling pressure from these entities.
In this context, BTC miners seem to have digested the majority of the Halving induced decline in revenues that led to a decline in hash rate. The overall Bitcoin hash rate has recently reclaimed new all-time highs which signals that Bitcoin miners on aggregate are less under pressure from an economic perspective. The hash ribbon signal presented in last month's report has also flashed a positive signal again.
Bottom Line: July saw increased seller exhaustion and recovery in Bitcoin, marked by the German government's sale of 50k BTC, which led to widespread capitulation and a tactical price bottom. Improved market conditions, evidenced by increased Bitcoin ETP flows and a record-high Bitcoin hash rate, combined with political support, suggest a potential for renewed retail participation and a sustained bull cycle, bolstered by the Bitcoin Halving event's anticipated positive impact over the next year.
Bottom Line
- Performance: In July, cryptoassets rebounded from oversold levels, with Bitcoin outperforming traditional assets amid potential Fed rate cuts, while Ethereum underperformed due to Grayscale outflows.
- Macro: Worsening US economic and labor market conditions support imminent Fed rate cuts, which, despite short-term challenges for Bitcoin, could ultimately benefit it due to positive political developments and reduced correlation with traditional assets.
- On-Chain: July saw a tactical Bitcoin price bottom due to seller exhaustion, improved market conditions, and political support, suggesting potential for renewed retail participation and a sustained bull cycle, bolstered by the positive impact of the Bitcoin Halving event.
Appendix
Cryptoasset Market Overview

Cryptoassets & Macroeconomy

Cryptoassets & Multiasset Portfolios

Cryptoasset Valuations

On-Chain Fundamentals
Important information:
This article does not constitute investment advice, nor does it constitute an offer or solicitation to buy financial products. This article is for general informational purposes only, and there is no explicit or implicit assurance or guarantee regarding the fairness, accuracy, completeness, or correctness of this article or the opinions contained therein. It is advised not to rely on the fairness, accuracy, completeness, or correctness of this article or the opinions contained therein. Please note that this article is neither investment advice nor an offer or solicitation to acquire financial products or cryptocurrencies.
Before investing in crypto ETPs, potentional investors should consider the following:
Potential investors should seek independent advice and consider relevant information contained in the base prospectus and the final terms for the ETPs, especially the risk factors mentioned therein. The invested capital is at risk, and losses up to the amount invested are possible. The product is subject to inherent counterparty risk with respect to the issuer of the ETPs and may incur losses up to a total loss if the issuer fails to fulfill its contractual obligations. The legal structure of ETPs is equivalent to that of a debt security. ETPs are treated like other securities.
 En
En  Fr
Fr  De
De 