- Bitcoin and other cryptoassets underperformed traditional financial assets in April, largely influenced by stricter US financial conditions and unfavorable on-chain data, with altcoins experiencing even greater declines than Bitcoin
- Tighter U.S. financial conditions could initially hinder Bitcoin, but anticipated shifts to more supportive monetary policies amid increasing recession risks and labour market deterioration may benefit it medium to long term, despite temporary growth spurts in China
- On-chain metrics hint at an interim cycle top for Bitcoin, predicting short-term weakness until the 2024 Halving effects surface, though signs of accumulation and bearish sentiment suggest imminent price stabilization
Chart of the Month
Performance
Last month, cryptoassets underperformed traditional assets in a broader risk-off environment. Risky assets such as US equities also came under pressure due to a tightening in US financial conditions which was reflected in a strengthening US Dollar and rising bond yields. In addition, increasing tensions in the Middle East led to a clear surge in geopolitical risks and commodity prices.
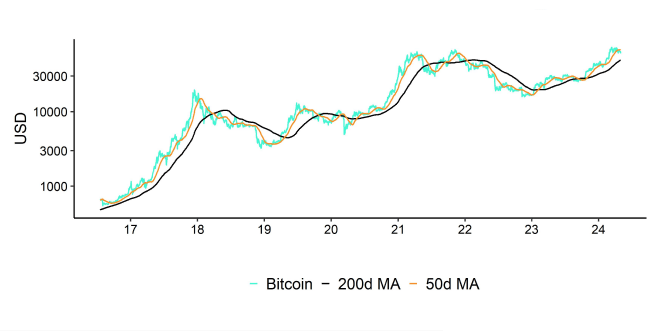
Despite the highly anticipated Bitcoin Halving, Bitcoin took a beating due to rising profit-taking by both long- and short-term holders. At the same time, global Bitcoin ETP net fund inflows decelerated significantly in April mostly due to slower flows into US spot Bitcoin ETFs. As a result, net buying minus selling volumes on Bitcoin spot exchanges turned negative which exerted pressure on the price.
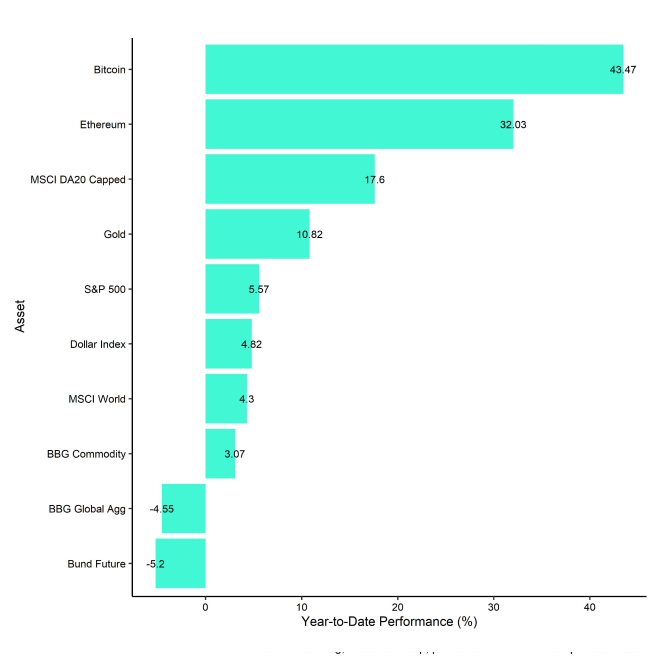
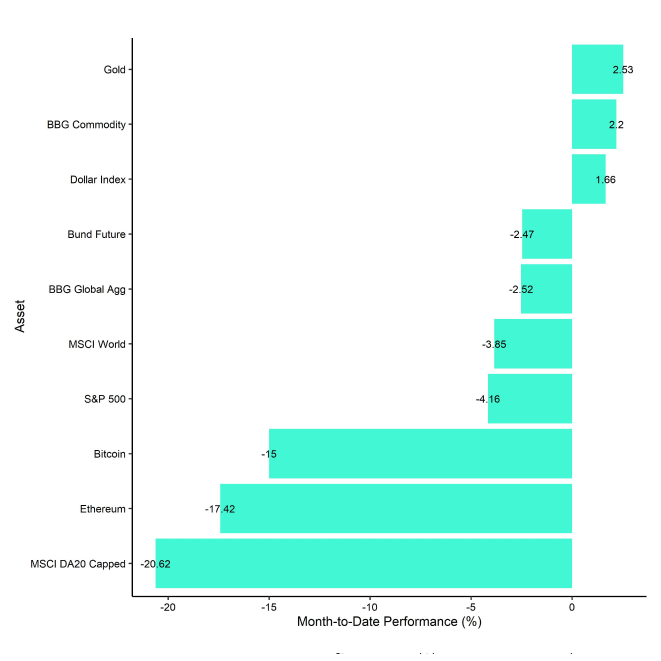
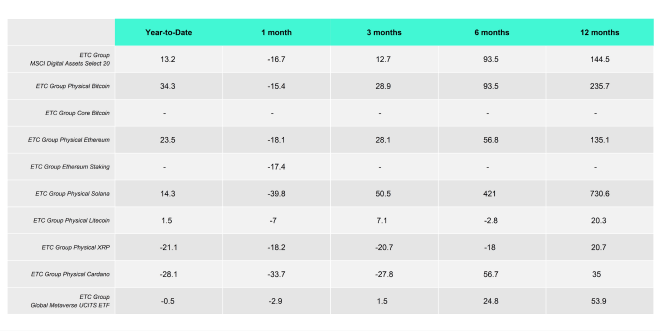
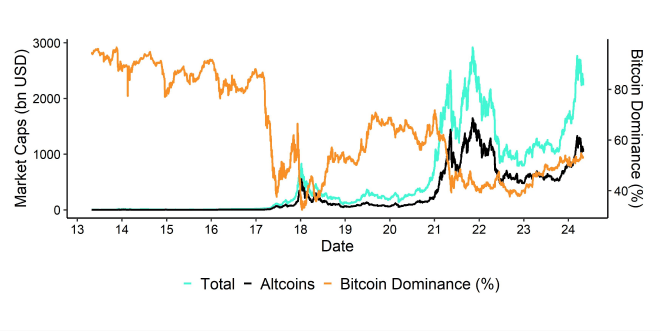
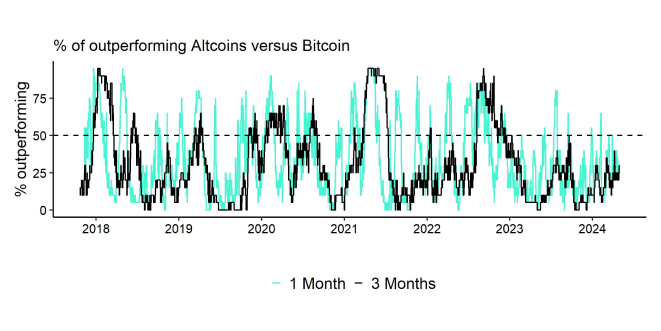
A look at our product performances reveals that altcoin ETPs such as the ETC Group Physical Cardano (RDAN) or ETC Group Physical Solana (ESOL) generally underperformed the ETC Group Physical Bitcoin (BTCE) in April as Bitcoin's market cap dominance continued to increase.
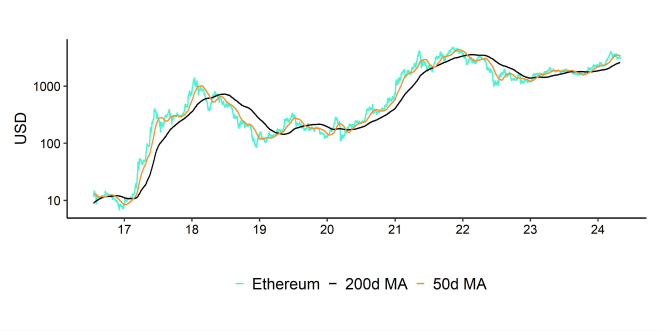
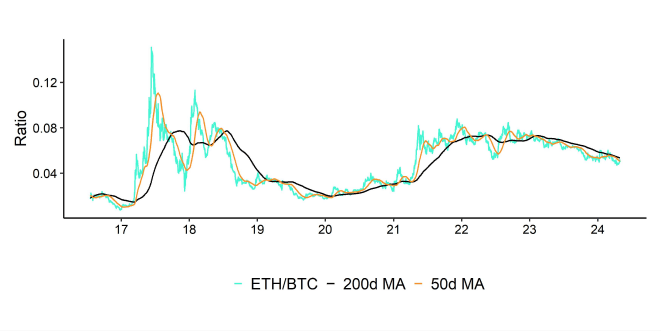
All in all, the market continues to focus on large caps like Bitcoin or Ethereum probably due to the increasing concentration of ETPs being issued only on these 2 cryptoassets in the US and Hong Kong this year.
Bottom Line: Bitcoin and cryptoassets underperformed traditional financial assets due to tightening in US financial conditions and negative on-chain data. Altcoins generally underperformed Bitcoin in April.
Macro Environment
Financial conditions have tightened slightly more recently but still remain relatively loose. In the short-term, the risk is that inflation expectations might increase due to increasing geopolitical tensions which could lead to a tightening in financial conditions.
The reason is that disruptions to global supply chains on account of geopolitical tensions could result in higher input costs. Moreover, increases in commodity prices like crude oil could additionally fuel the inflation fire in the short term. This could additionally be exacerbated by the recent Chinese growth reacceleration in the short term.
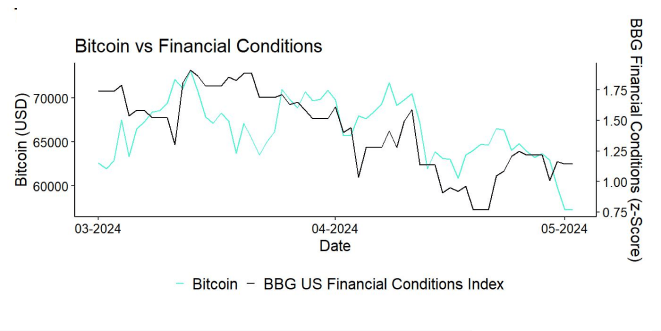
Most pundits have attributed the most recent price correction in Bitcoin and cryptoassets to rising geopolitical risks. Indeed, geopolitical risks have definitely increased judging by the Geopolitical Risk Index presented below. That being said, the recent rise in geopolitical risks was preceded by tightening US financial conditions as well:
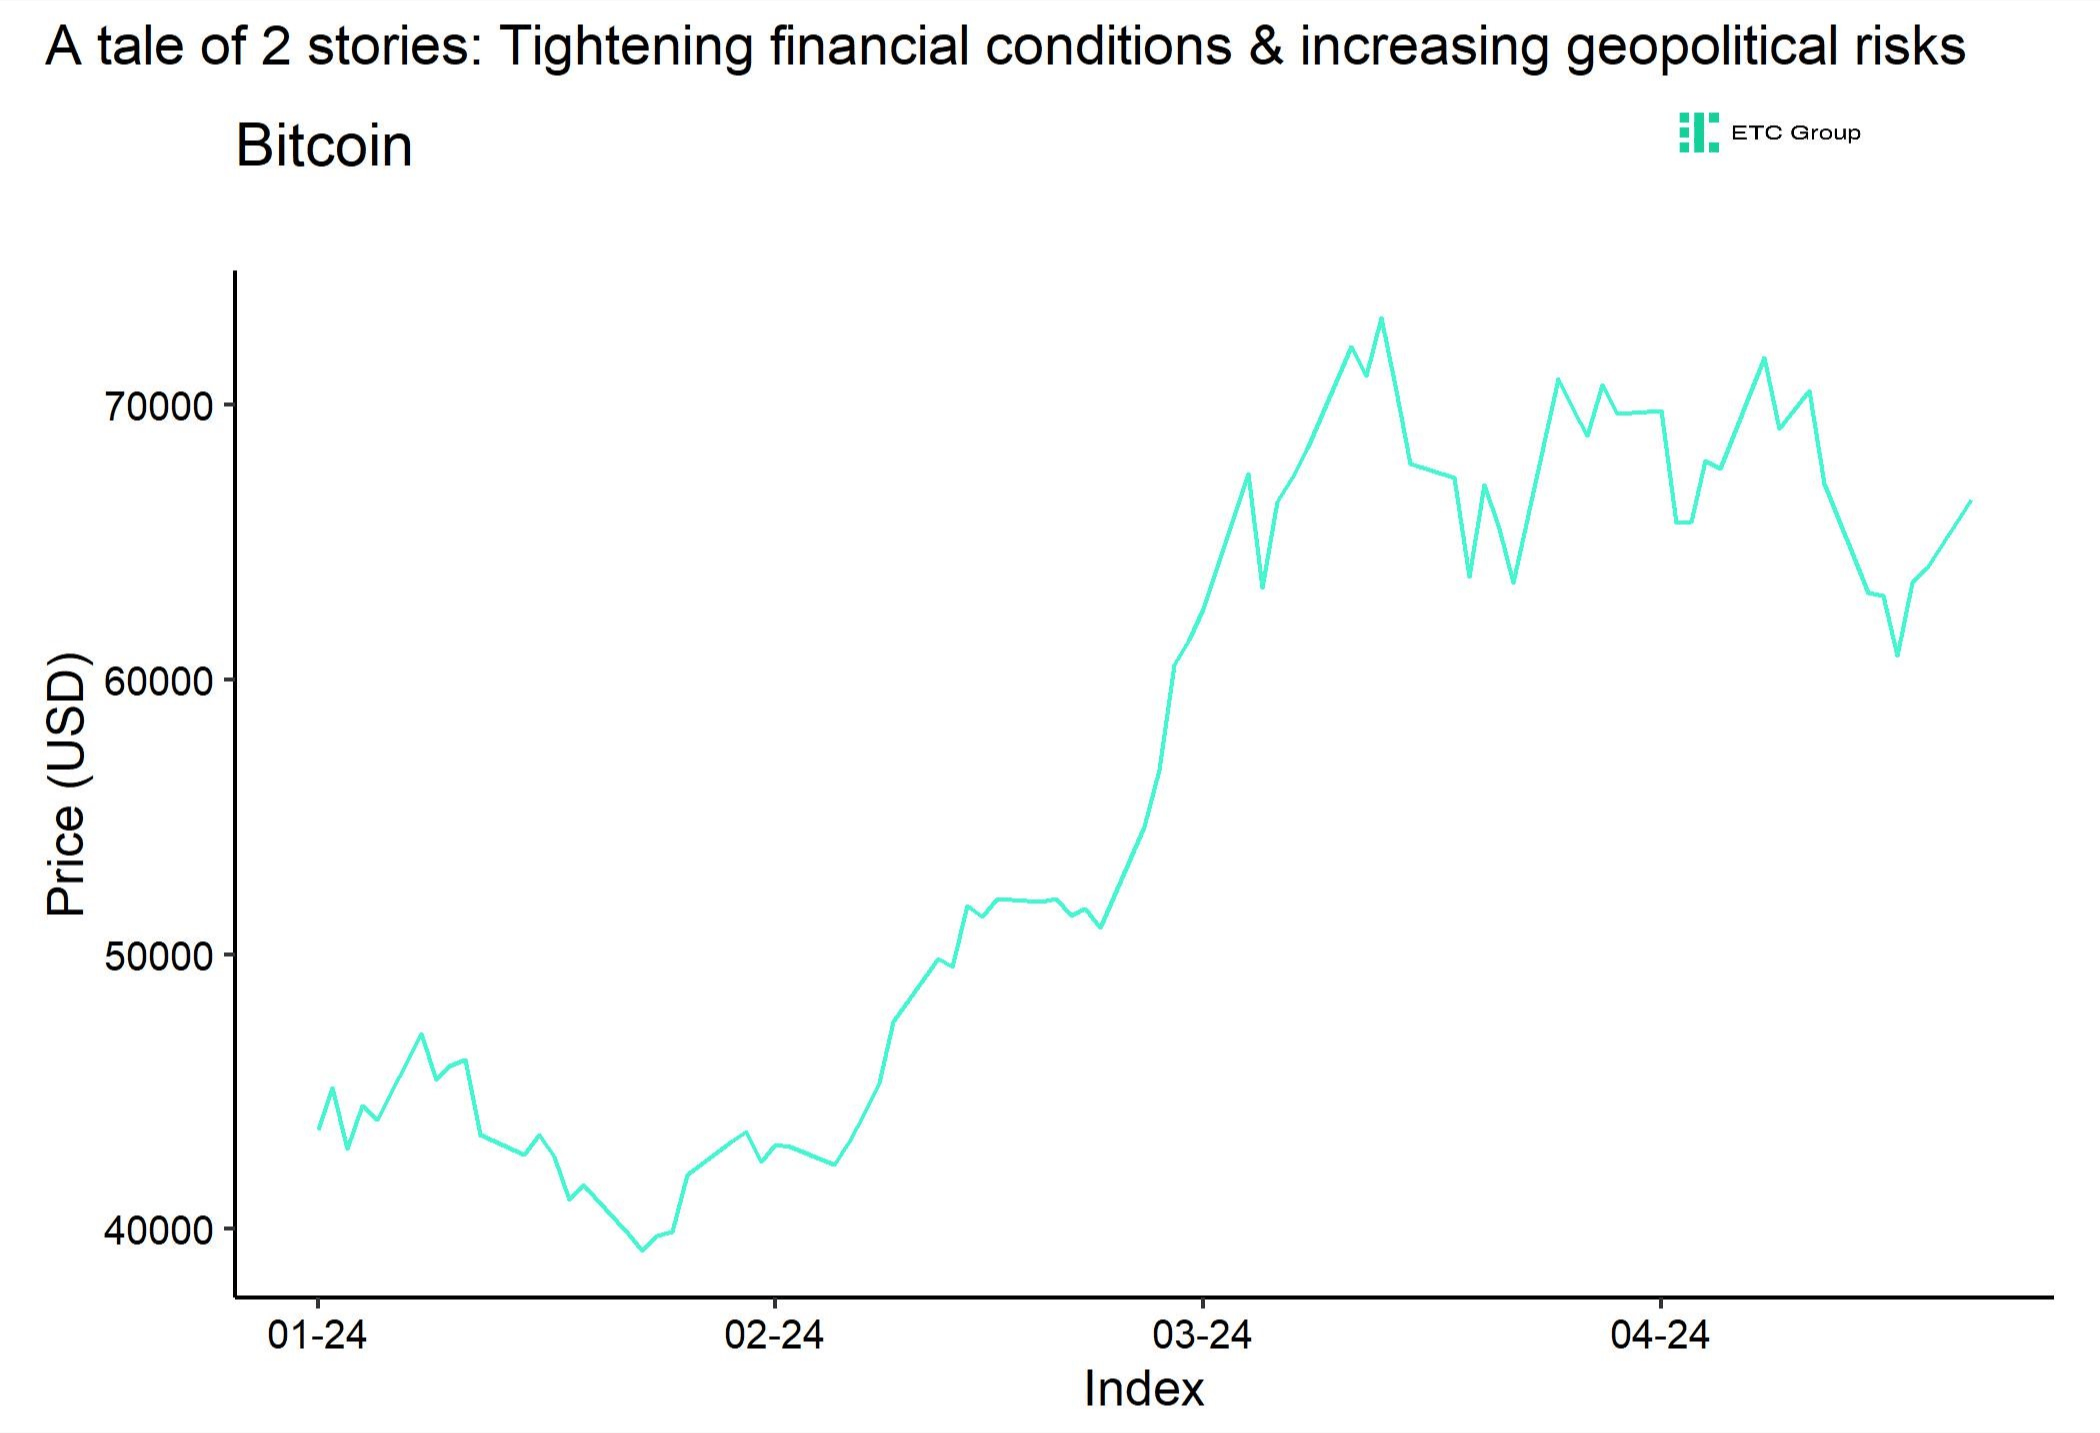
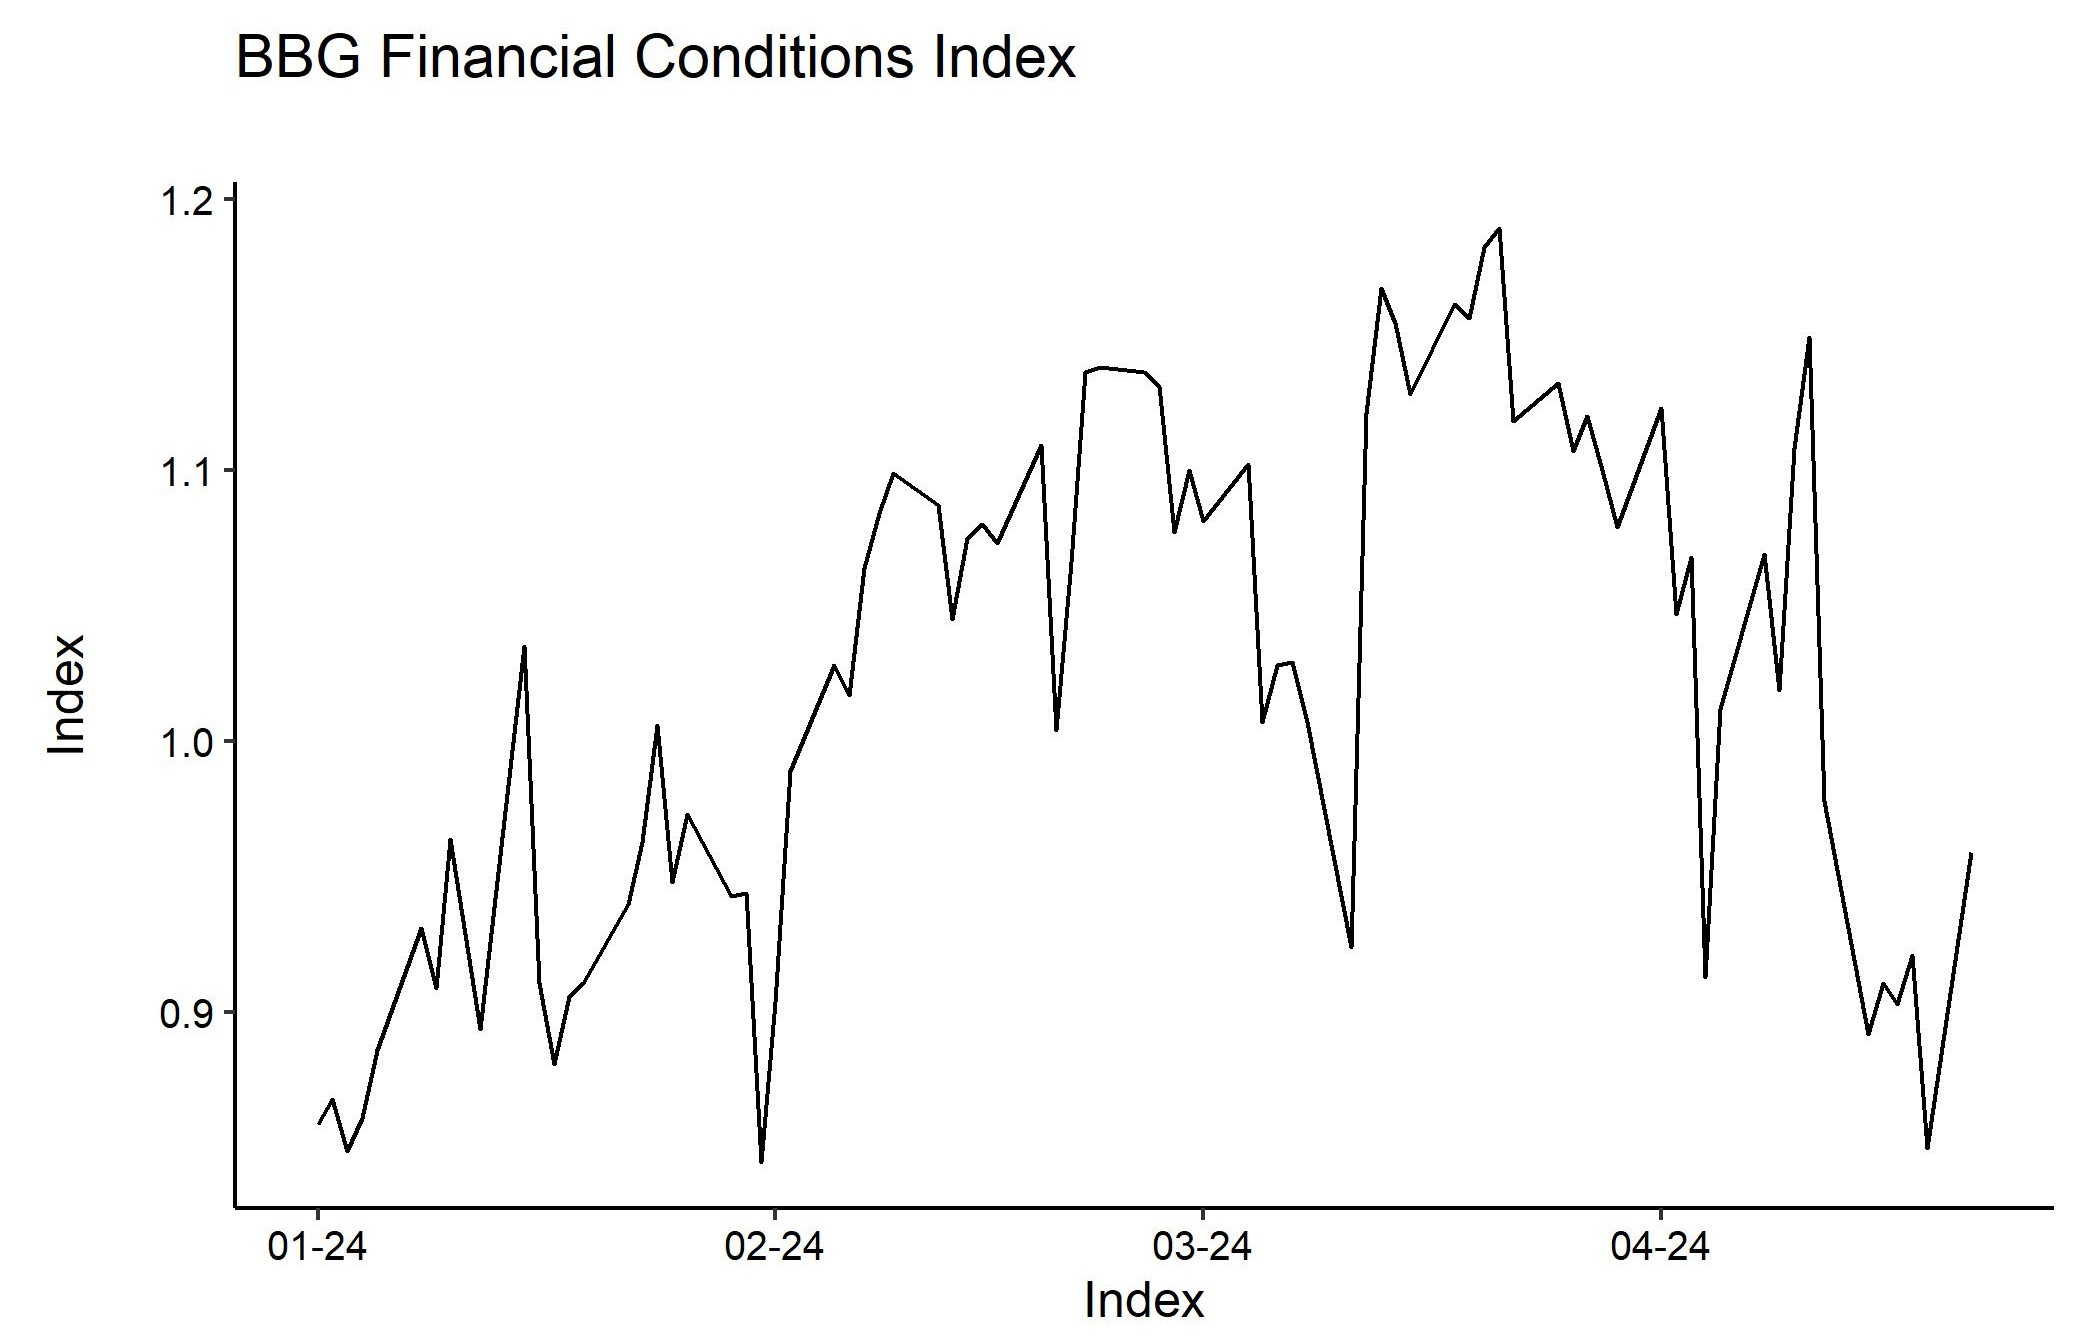
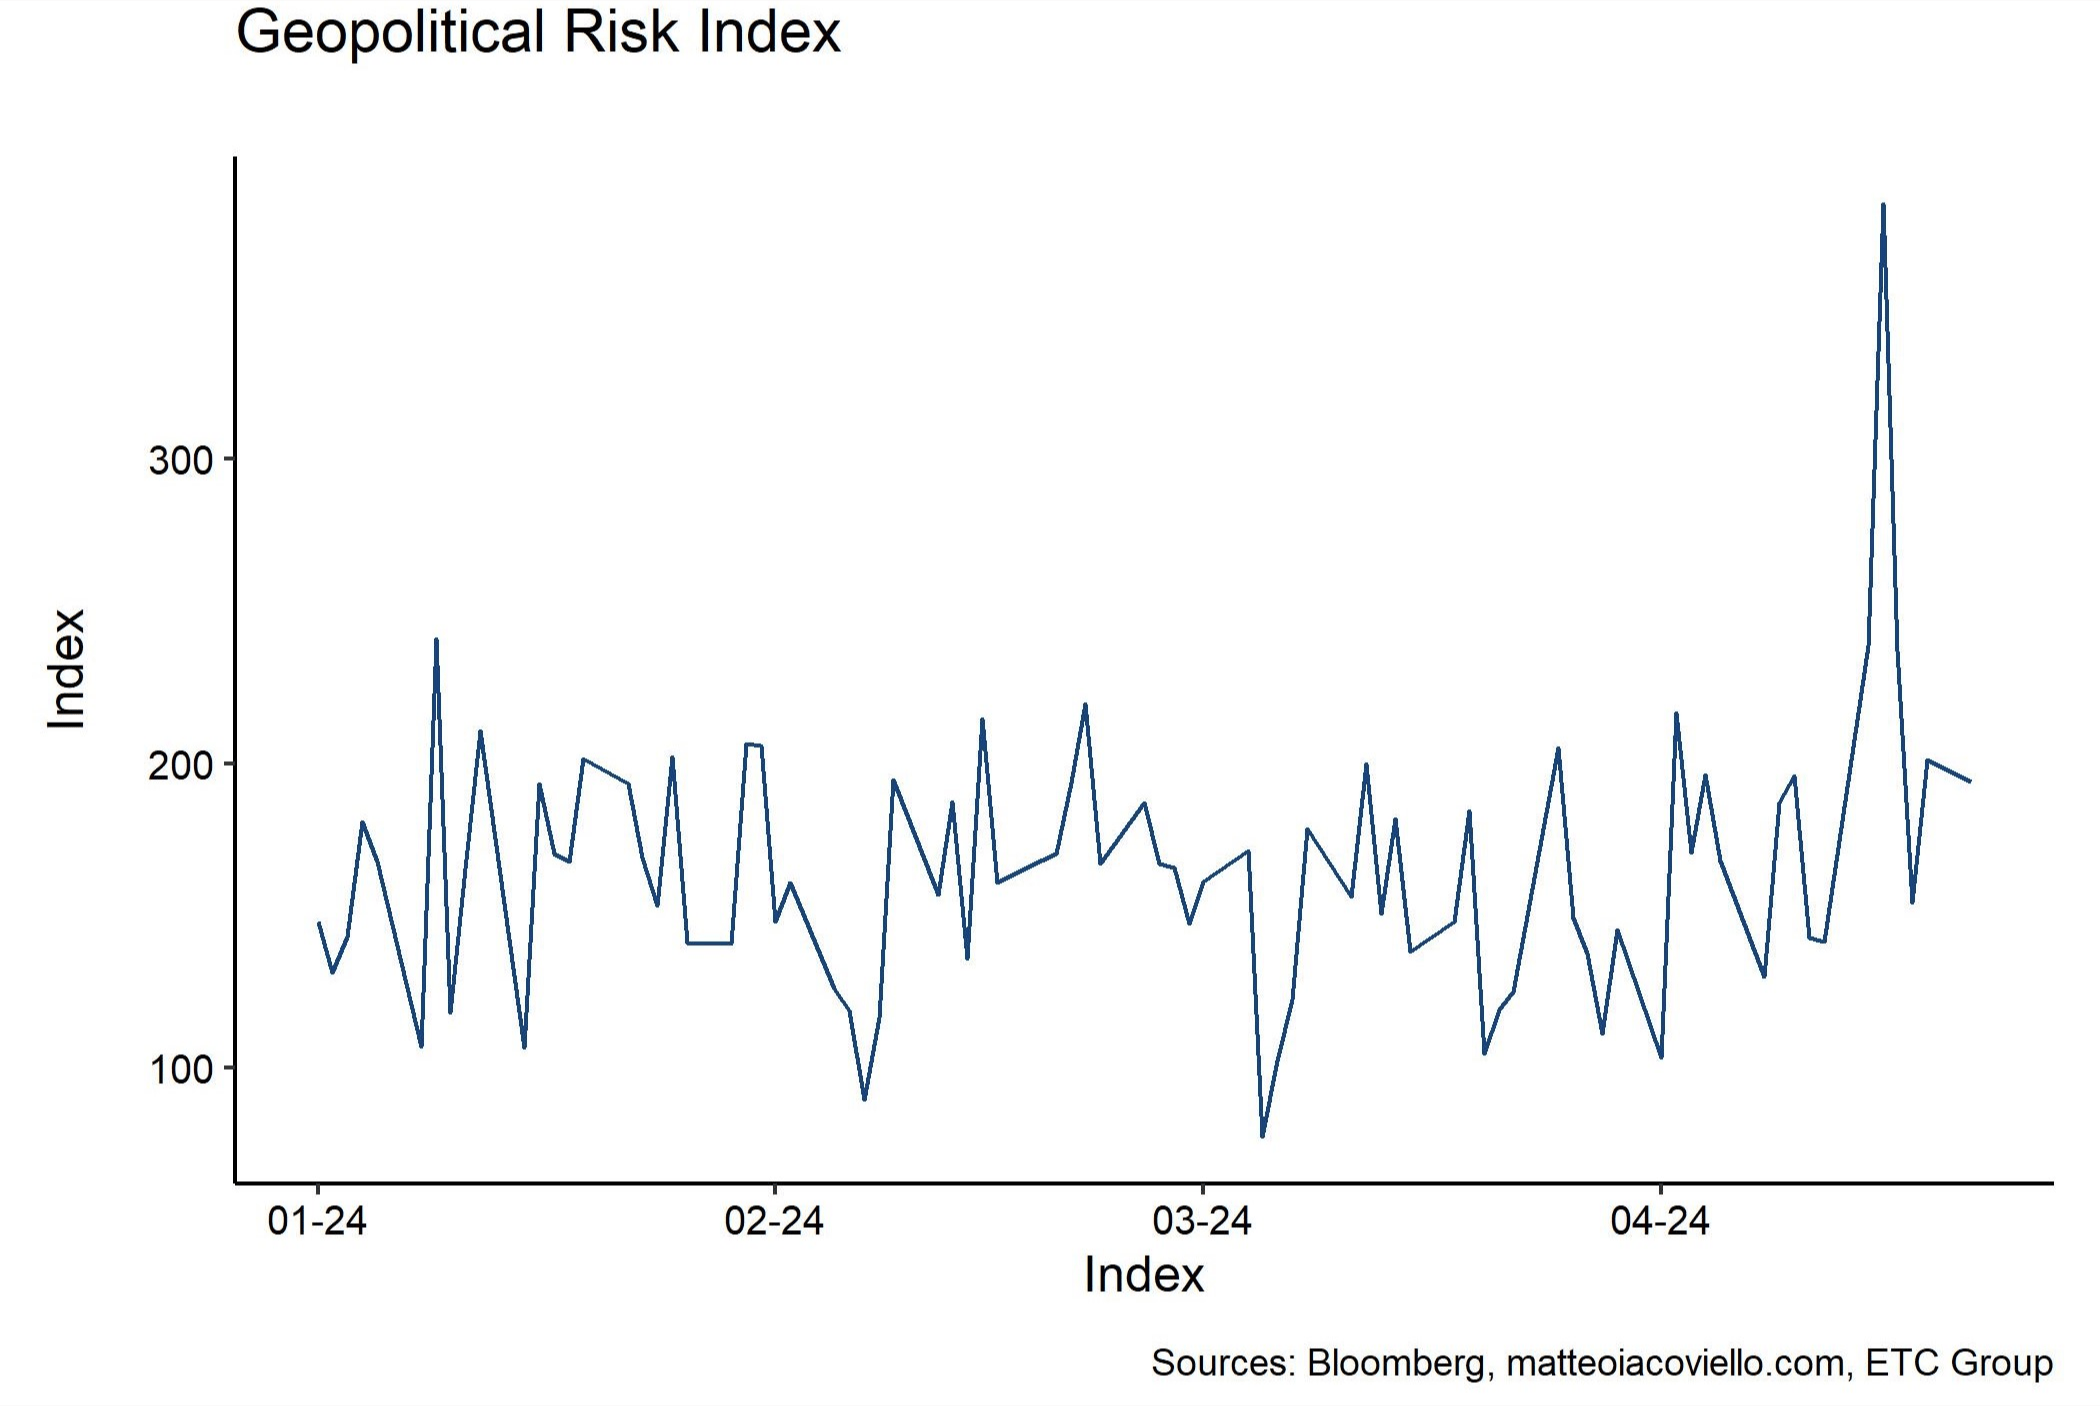
We think that financial conditions could have room to tighten further in the short-term which would certainly be a headwind for Bitcoin as well. The reason is that Bitcoin's performance is generally tightly correlated with overall US financial conditions.
Expectations for monetary policy have generally been tightening throughout 2024. We went from approximately 6 cuts expected by the market in 2024 at the beginning of the year to only 1 cut expected for 2024 currently based on Fed Funds Futures.
We expect that the recent marginal tightening in monetary policy expectations will be reflected in tighter financial conditions as well. The recent Yen depreciation is also indicative of much broader Dollar appreciation pressure and tightening US financial conditions.
This tends to be net bearish for Bitcoin and cryptoassets in the short term.
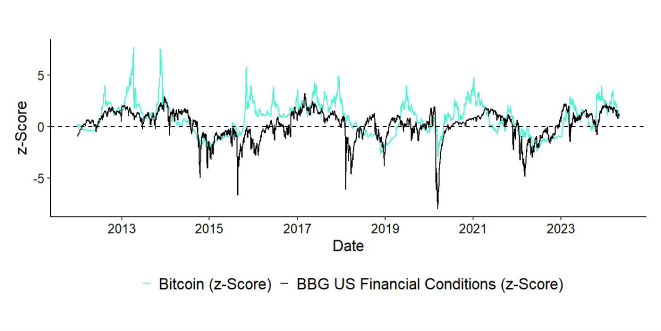
However, we expect that over the medium- to long-term financial conditions in the US should stay loose on account of rising US recession risks and a final reversal in Fed monetary policy. The latest FOMC meeting with a slower pace of planned divestments from US Treasuries is also pointing in that direction.
More specifically, beginning in June, the Fed will slow the pace of decline of its securities holdings by reducing the monthly redemption limit of US Treasuries from 60 bn USD per month to 25 bn USD per month.
Our general macro base case remains a US recession by summer 2024 as outlined in our ETC Group 2024 Outlook report.
At the time of writing the term structure model still implies a recession probability of 50.7% over the coming 12 months.
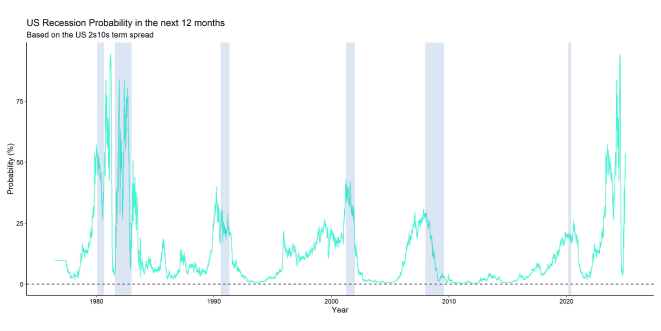
The 2s10s US Treasury term spread still remains inverted which is generally a recession signal. The current inversion of the yield curve that already began in July 2022 has been one of the longest yield curve inversions in the financial history of the US.
Furthermore, leading indicators of the US labour market such as job openings continue to decline. Broad labour market indicators like the labor market conditions index by the Kansas City Fed also continue to deteriorate.
Viewed more broadly, there is a clear bifurcation between large and small businesses in the US. Russell 2000 (small caps) company earnings have essentially been stagnant since 2021 while S&P 500 (large caps) company earnings have climbed to new all-time highs led by a few mega-caps like Nvidia. Current earnings and sales reporting in the NFIB small business survey have reached lows last seen during the Covid-induced recession.
It comes as no surprise that hiring intentions in the NFIB small business survey in the US – a leading indicator for employment - have continued to deteriorate. In fact, NFIB hiring intentions already point to a stagnation in overall US employment growth in the summer.
But the deterioration is not confined to small businesses alone. Most of the recent increase in non-farm payroll employment in the US over the past months was related to increases in part-time employment.
Meanwhile, full-time employment is already contracting (!) on a year-over-year basis which was historically never a good sign. There was only one false positive tied to May 2011 which was not immediately followed by a recession as the only exception.
Other leading indicators for employment such as the ISM employment sub-components for manufacturing and non-manufacturing are signalling deteriorating labour market conditions as well. Both sub-components posted sub-50 readings in March.
A clear sign for an imminent US recession would be a triggering of the so-called “Sahm Rule”:
The US economy has always entered a recession without exception if the 3-months average of the unemployment rate had increased by 50 bps from its 12-months rolling low. At the time of writing, this rule has not been triggered on a national level but already more than 20 US states have triggered this rule on a regional level.
In this context, it is important to note that the lesser known “Mel Rule” has already been triggered. The Mel Rule signals a recession when the unemployment rate calculated by aggregate state-level data rises 0.25%-points above its 18-months low. The Mel Rule tends to be more timely than the Sahm Rule.
All in all, this increases the odds of a more dovish forward guidance by the Fed and ultimately the commencement of a rate cutting cycle later in the second half of 2024.
The important question is: What are the implications for Bitcoin?
Unfortunately, we have not many data points to assess the potential impact of a US recession on the performance of Bitcoin and cryptoassets more broadly. The only observation we have is the Covid recession in 2020 since reliable price data for Bitcoin only exist since 2011 and the previous US recession was in 2008 (Sub-Prime Crisis).
During the Covid recession in 2020, Bitcoin experienced a max drawdown of more than -50%. The good news is that Bitcoin recovered briskly amid strong monetary and fiscal stimuli and the previous Bitcoin Halving that happened in May 2020. At the end of 2020, Bitcoin was up by more than +300% despite the Covid recession.
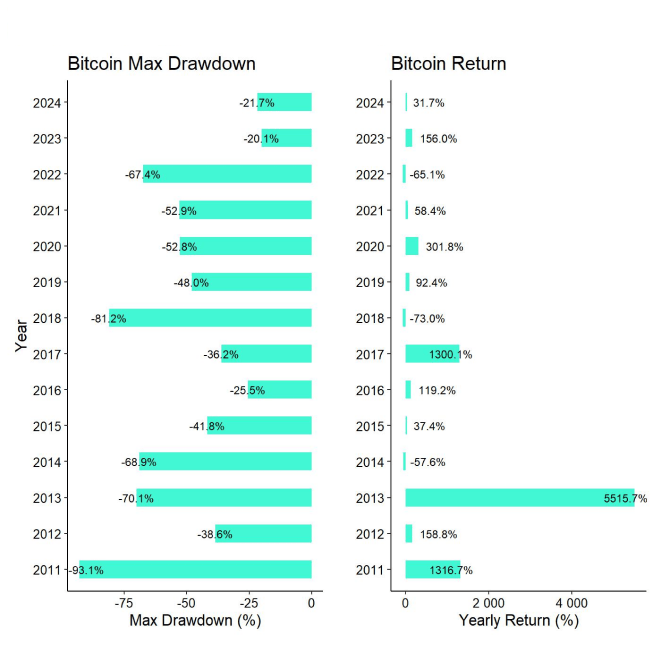
Based on this blueprint, we might witness a similar development this year, with a potentially larger drawdown induced by a recession in the US and global risk-off with a subsequent strong rallye due to a reversal in monetary policy and the belated effect of the Halving.
However, from a quantitative perspective it is important to note that Bitcoin but also traditional financial assets like US equities remain particularly sensitive to changes in global growth expectations.
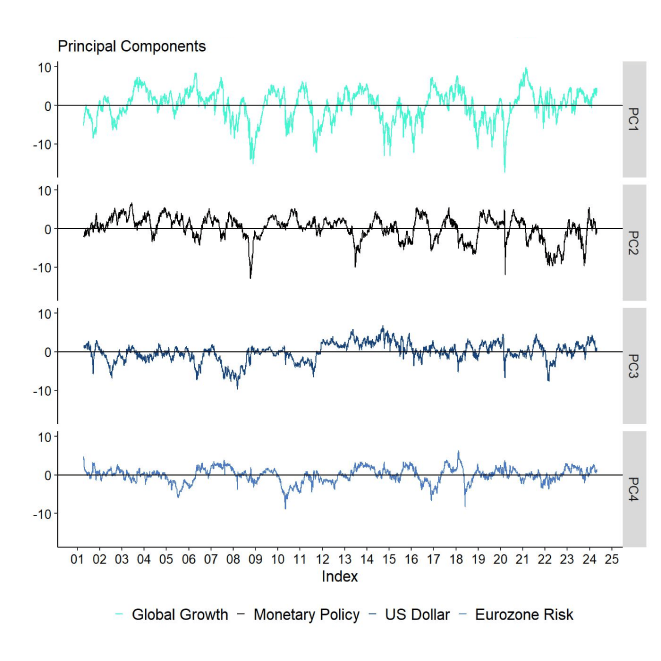
More specifically, based on a principal component analysis of latent macro factors priced by financial markets we estimate that Bitcoin's performance was mostly dominated by changes in global growth expectations and not changes in either monetary policy expectations or the US Dollar. Read more about this macro modelling approach here.
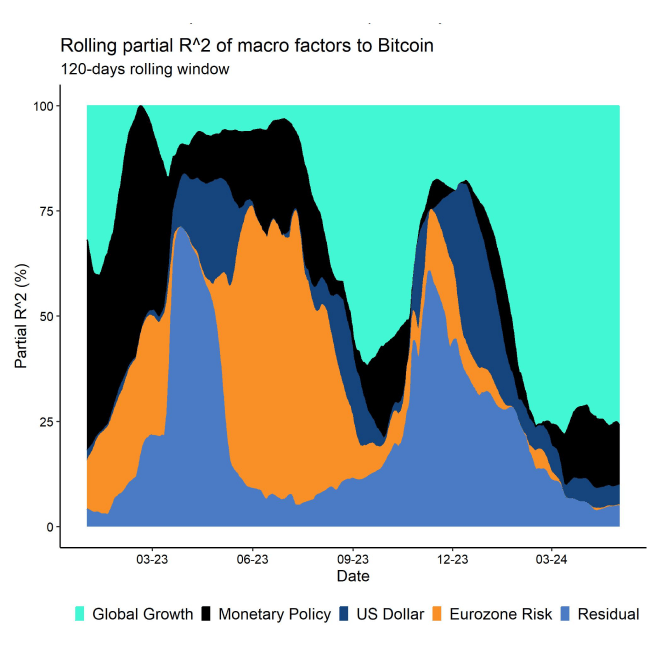
More specifically, around 75% of the variation in Bitcoin could be explained by changes in global growth expectations over the past 120 trading days.
As mentioned above, the recent reacceleration in Chinese growth momentum could be an upside “risk” to that recession view presented above. High frequency indicators most sensitive to China growth expectations such as copper have recently rebounded sharply which was also one of the reasons for rising US inflation expectations (CPI swaps) as well.
However, we expect this reacceleration to be rather short-lived since the Chinese credit impulse – a leading indicator for China growth – continues to be negative and stagnant at the moment. The Keqiang Index, which is an alternative measure of Chinese growth momentum consisting of rail freight traffic, electricity production and bank lending, also declined to the lowest level since 2020.
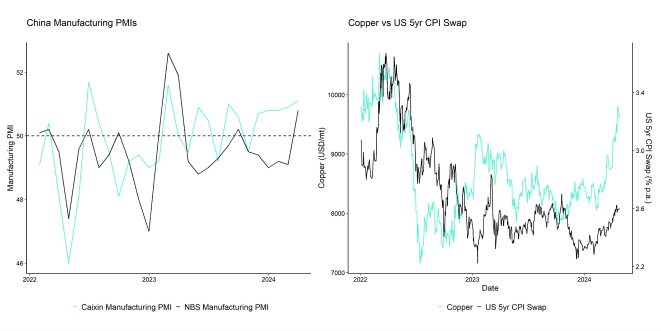
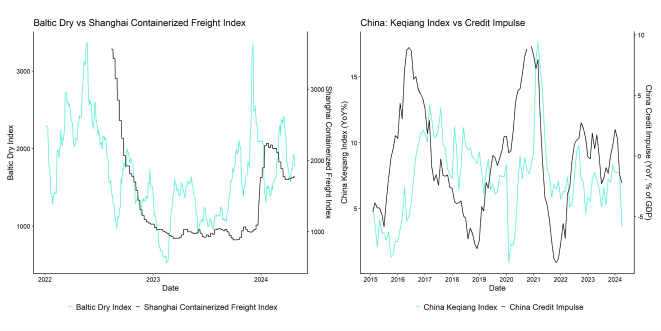
Bottom Line: Tightening financial conditions in the US could be a headwind for Bitcoin in the short term. However, rising US recession risks imply that monetary policy will ultimately become accommodative again over the medium to long term. Labor market conditions have continued to deteriorate in the US which renders recession more likely. Recent reacceleration in Chinese growth momentum presents an upside “risk” to this view. However, Chinese credit impulse implies that reacceleration will only be short-lived.
On-Chain Developments
Probably the most anticipated on-chain event during the month of April was the Bitcoin Halving. The 4th Bitcoin Halving since Bitcoin's genesis occurred on the 20 th of April at 02:09:27 UTC when the 840000 th block was mined. This halved the block subsidy from 6.25 BTC to 3.125 BTC and the daily issuance fell from approximately ~900 BTC per day to ~450 BTC day.
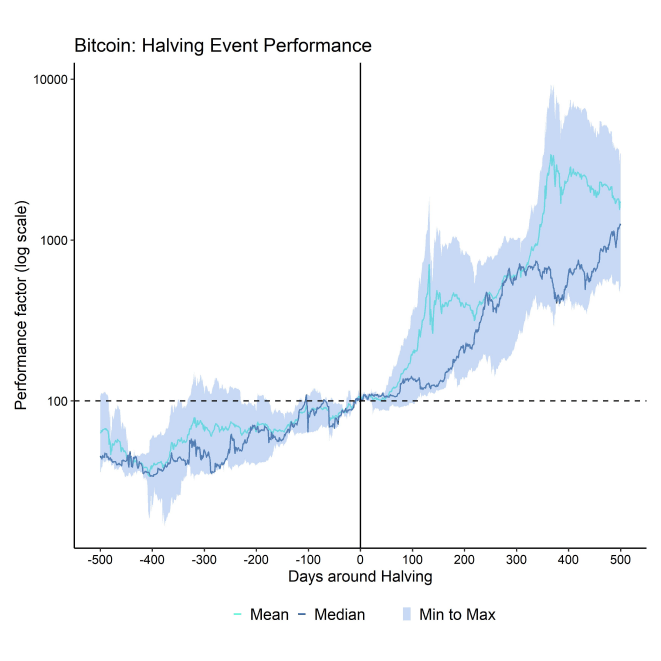
As outlined in our special report on the Having, we expected the Halving day itself to be a non-event in terms of performance. The reason is that the price effect has only become statistically significant around 100 days after the Halving on average. So, we still expect Bitcoin to start reacting to the accumulative supply deficit induced by the Halving around July 2024 earliest.
July and August tend to be rather “boring” months for Bitcoin from a pure seasonality perspective with significantly below average and even negative returns. However, this summer could turn out to be more interesting due to the Halving effect described above.
Our key message here remains that the Bitcoin Halving is most likely not priced in yet and that the majority of Halving related gains will likely materialize until the end of 2025.
Apart from the halving of the block subsidy, there were other noteworthy developments at the Halving date.
In response to the BRC-20 tokens, Runes were introduced by Casey Rodarmor in autumn 2023 and went live with the Halving Block 840000 on the 20 th of April 2024. Technically speaking, runes use Bitcoin's OP_RETURN function, which allows up to 80 bytes of data to be written to the Bitcoin blockchain.
In contrast to BRC-20 tokens, runes are no longer part of the UTXO set as they cannot be spent. Another advantage over BRC-20 is that runes are integrated directly into the ord software and map the entire state on the blockchain without the need for additional software.
Runes are 'etched' into the Bitcoin blockchain through a so-called 'etching' transaction. There are only a few variable properties when creating runes such as name, divisibility, premine, symbol, terms, and supply.
A negative byproduct of the Halving and Runes was the very significant increase in network transaction fees due to an increase in transaction count and the simple fact that users bid up average transaction fees to be included in the Halving block. As a result, mean transaction fees spiked to the highest level since December 2017.
This had led to a significant decrease in active addresses as users were disincentivized to transact on the core Bitcoin blockchain. It is important to note that the decline in active addresses was not associated with a decline in hash rate due to the Halving. Active addresses have reversed some of these declines though.
So far, the Halving of the block subsidy did not have a significant negative effect on the overall Bitcoin hash rate. The network hash rate has continued to climb and even reached a new all-time high 3 days after the Halving on the 23 rd .
BTC reserves in miner wallets have also moved sideways since March with no material change after the Halving so far. We only saw a slight number of miner reserve liquidations in the immediate aftermath of the Halving. This implies that, on aggregate, BTC miners probably remain well-capitalized with no short-term liquidity issues that could lead to “miner capitulation”.
Based on our estimations, we still think that the current price also remains above the average marginal cost of production for most miners. Based on a set of assumptions, we estimate that the marginal cost of production is currently around 60.7k USD.
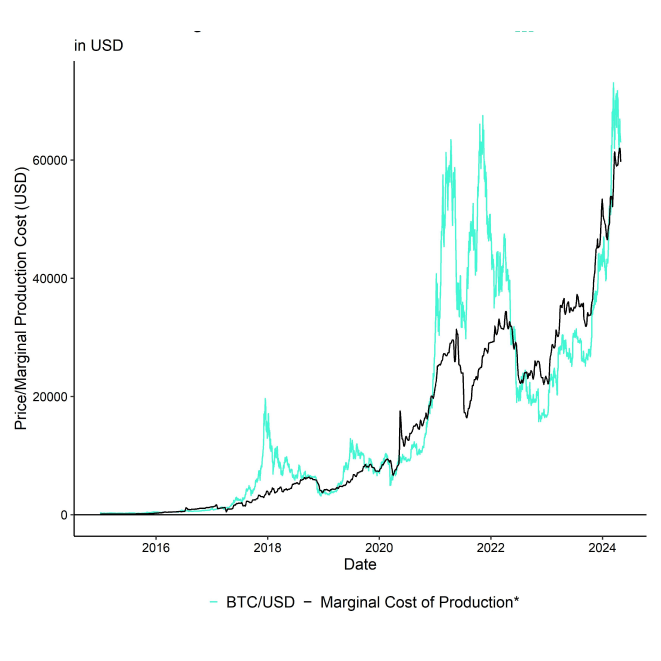
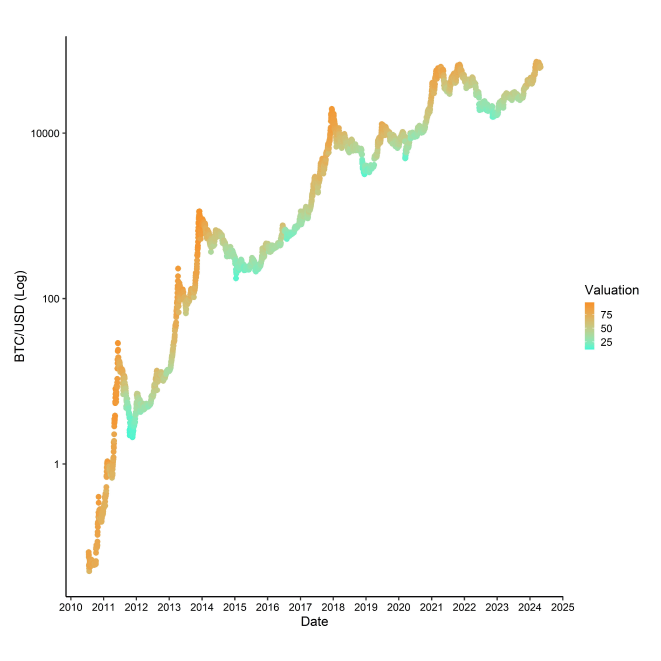
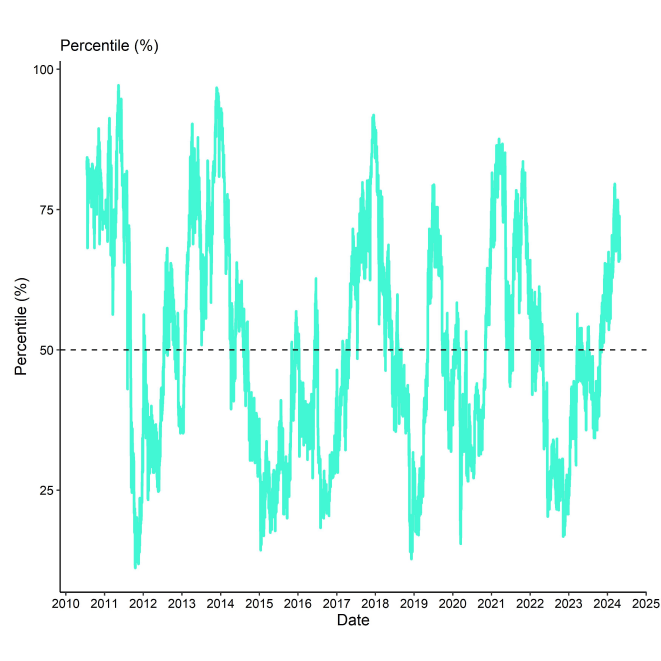
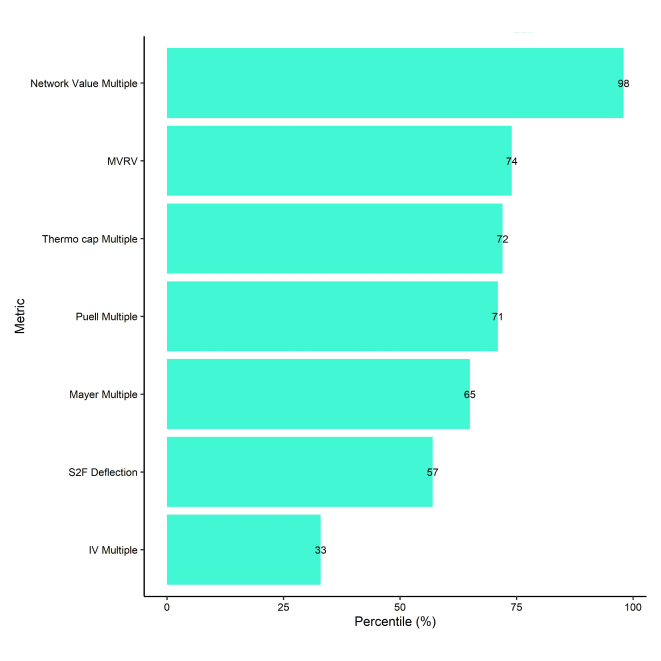
Speaking of valuations, overall valuations imply that Bitcoin is still moderately expensive with our in-house composite valuation indicator being at the 67% percentile.
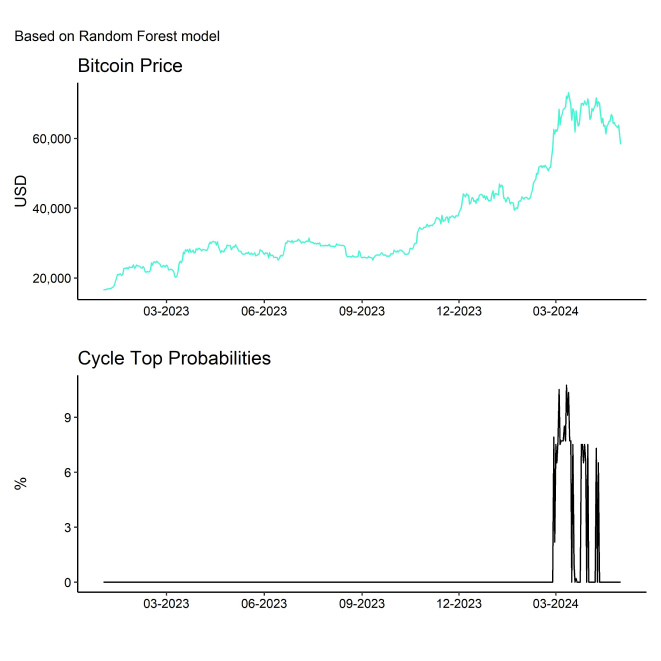
Based on a much broader set of valuation and on-chain metrics we think that the probability of an interim cycle top has certainly increased. More specifically, we have estimated a random forest model based on a set of 19 valuation indicators. The model's probability for a cycle top has recently increased to ~10% during the all-time high on the 13 th of March 2024.
In this context, the number of addresses in profits during the peak was particularly concerning. Many investor cohorts sat on a large number of unrealized gains. In fact, many investors took significant profits at these prices. In USD-terms, the profit-taking activity observed over the past months was the highest ever recorded.
On a positive note, profit-taking by long-term holders (LTH) who still have large unrealized gains has recently subsided. The same is true for profit-taking by short-term holders (STH), which has also subsided more recently.
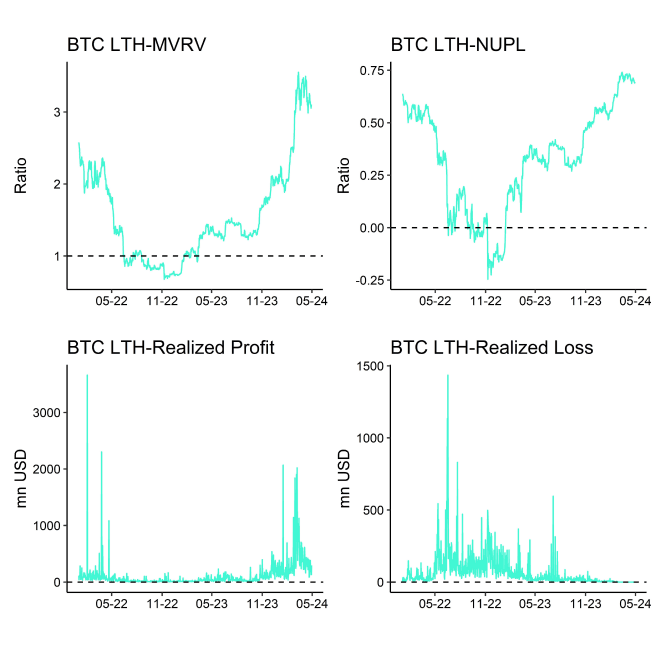
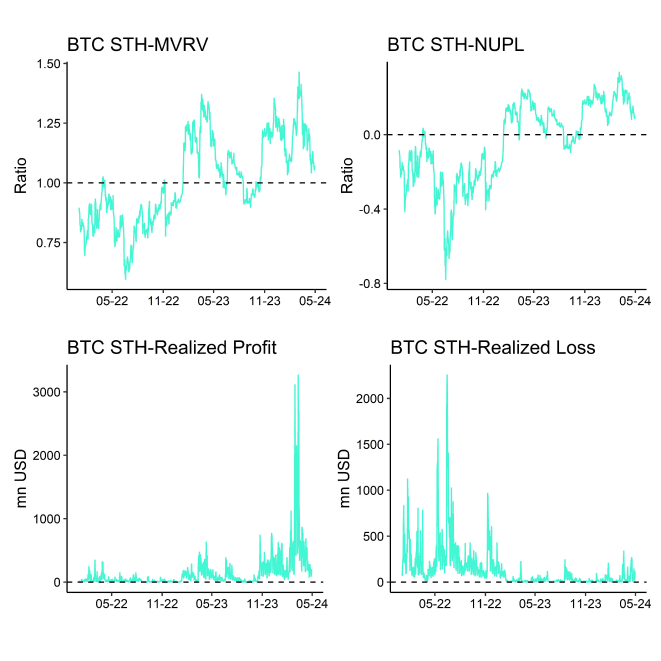
Combined with relatively bearish sentiment as reported in our latest Crypto Market Compass report as well, we expect further downside to be relatively limited in the short term.
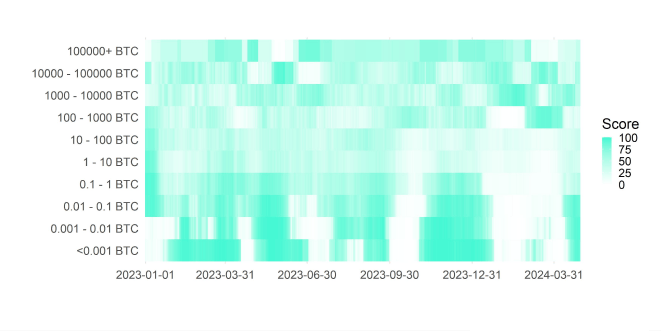
Moreover, accumulation activity across many different wallet cohorts has recently rebounded sharply into the most recent correction. This increases the odds of a short-term stabilization above 60k USD even more.
In other words, the short-term correction in Bitcoin appears to be exhausted and accumulation is accelerating again.
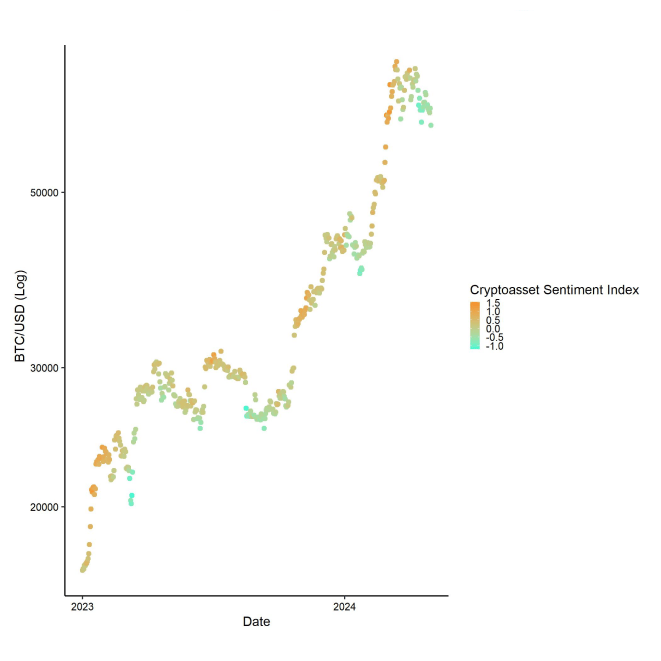
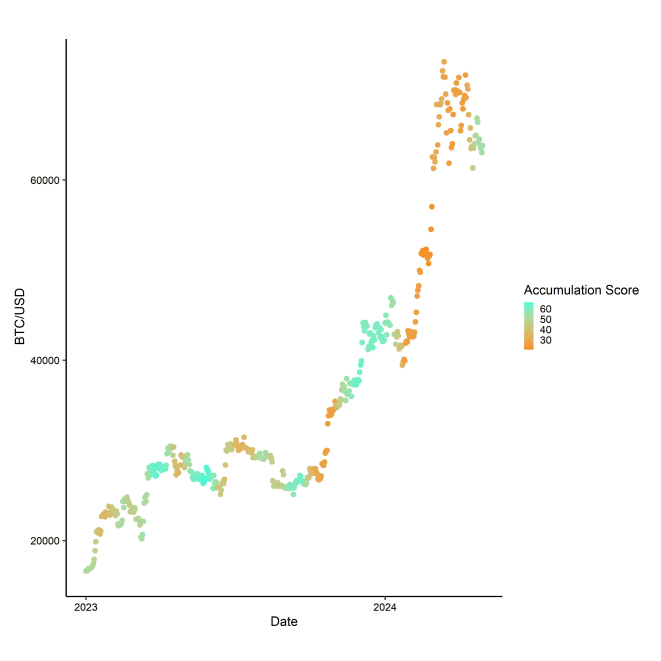
A risk remains the dismal net demand for Bitcoins on spot exchanges at the moment. Intraday spot buying minus selling volumes are currently flat. One of the reasons is that net fund flows into Bitcoin ETPs globally have mostly levelled off. The recent disappointing debut of Hong Kong spot Bitcoin ETFs has not materially changed that.
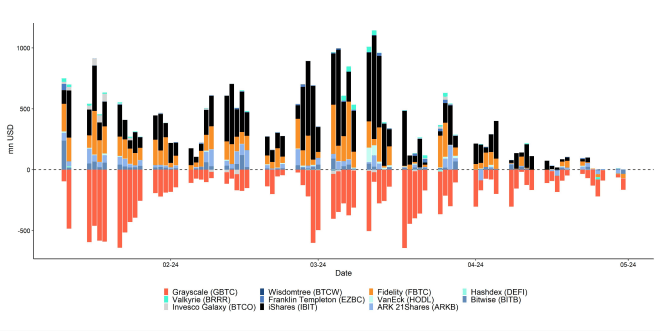
This could be due to several factors such as the worsening macro environment and tightening in broad US financial conditions more recently.
All in all, our base case remains a short-term weakness until the positive supply effect from the Halving starts to kick in by the end of July 2024.
Bottom Line: On-Chain valuation metrics suggest that the probability of an interim cycle top has increased. Our base case remains for a short-term weakness until the positive effect from the Halving starts to kick in around summer 2024. That being said, increasing accumulation activity and bearish sentiment suggest a short-term stabilization in prices.
Bottom Line
- Bitcoin and other cryptoassets underperformed traditional financial assets in April, largely influenced by stricter US financial conditions and unfavorable on-chain data, with altcoins experiencing even greater declines than Bitcoin
- Tighter U.S. financial conditions could initially hinder Bitcoin, but anticipated shifts to more supportive monetary policies amid increasing recession risks and labour market deterioration may benefit it medium to long term, despite temporary growth spurts in China
- On-chain metrics hint at an interim cycle top for Bitcoin, predicting short-term weakness until the 2024 Halving effects surface, though signs of accumulation and bearish sentiment suggest imminent price stabilization
Appendix
Cryptoasset Market Overview
Cryptoassets & Macroeconomy

Cryptoassets & Multiasset Portfolios
Cryptoasset Valuations
On-Chain Fundamentals


Copyright © 2024 ETC Group. All rights reserved


