- Cryptoassets outperformed last week, supported by a significant repricing in monetary policy expectations and short futures liquidations
- Our in-house “Cryptoasset Sentiment Index” still remains relatively elevated
- However, cryptoassets have recently pulled back as bitcoin investors are increasingly taking profits

Chart of the Week
Performance
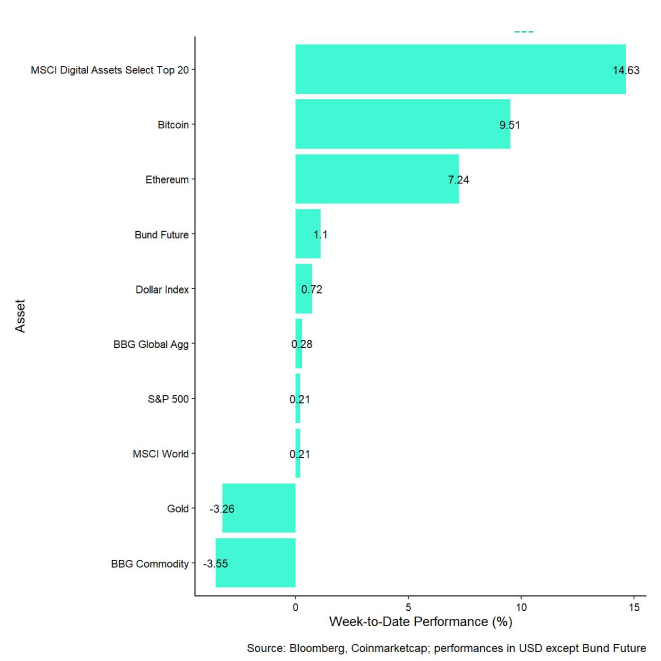
Last week, cryptoassets managed to outperform traditional assets like equities, again supported by a significant repricing in monetary policy expectations and short futures liquidations at the beginning of last week.
However, this outperformance appears to have reached some limits in the short term, as stronger than expected US jobs data last week on Thursday had already started to put a lid on the recent rallye.
More specifically, US non-farm payrolls growth and the unemployment rate were stronger than consensus estimates which led to a reversal in US Treasury yields albeit from low levels. This coincided with a decrease in overall risk appetite across traditional financial markets as well.
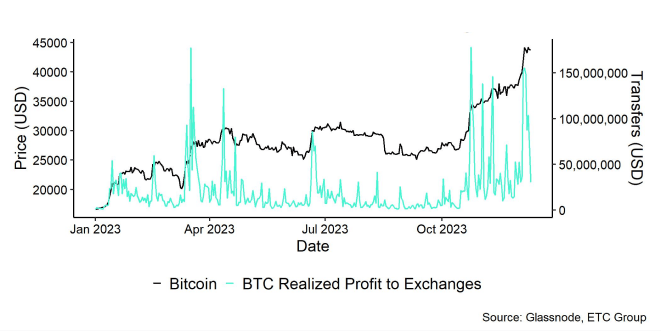
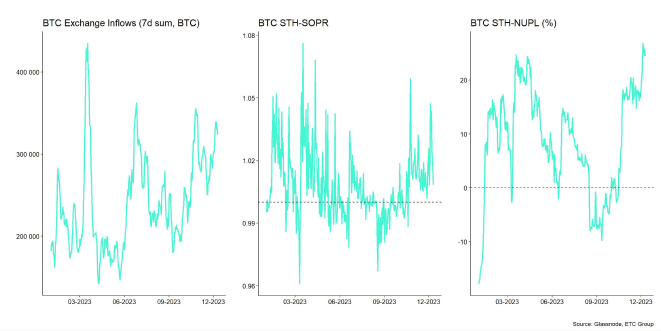
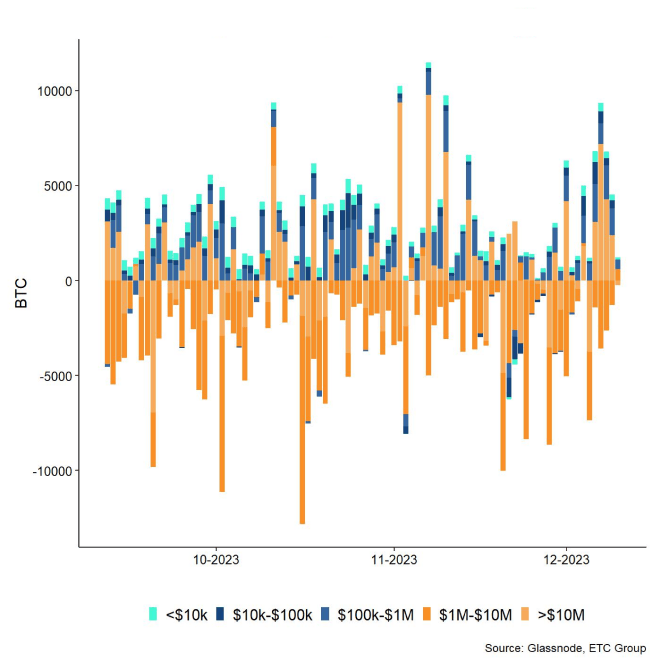
In addition, bitcoin on-chain data suggest that investors are increasingly taking profits amid still elevated cryptoasset market sentiment as evidenced by an increasing amount of coins in profit being sent to exchanges (Chart-of-the-week).
Nonetheless, as bitcoin's rallye took a pause, there was a significant increase in altcoin outperformance with Avalance and Cardano returning over 50% last week, respectively.
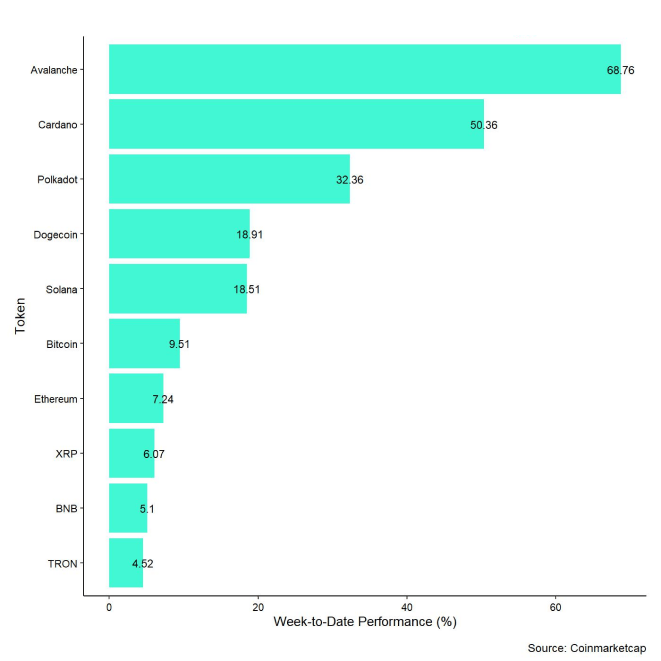
In general, among the top 10 crypto assets, Avalanche, Cardano, and Polkadot were the relative outperformers.
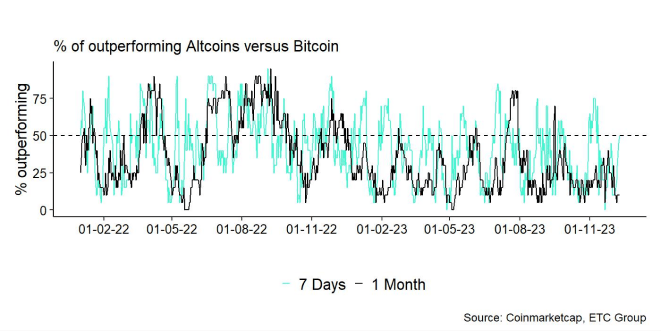
Altcoin outperformance vis-à-vis Bitcoin picked up significantly compared to the week prior, with 50% of our tracked altcoins managing to outperform Bitcoin on a weekly basis.
Sentiment
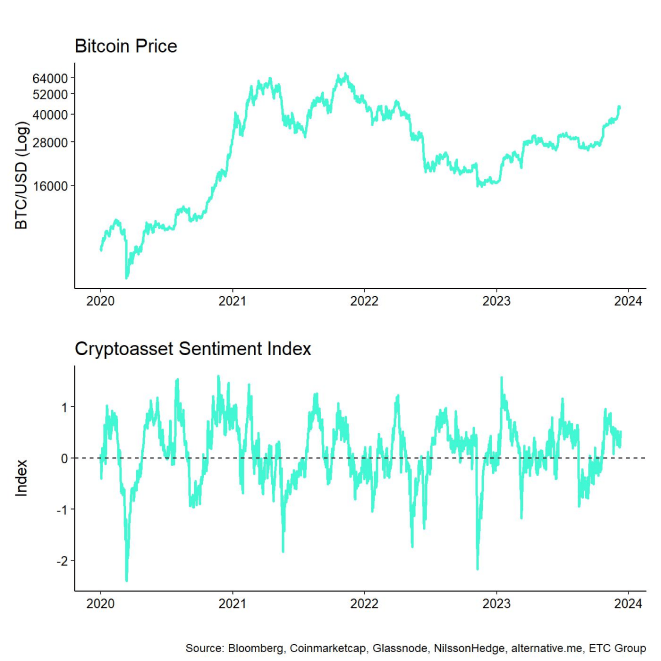
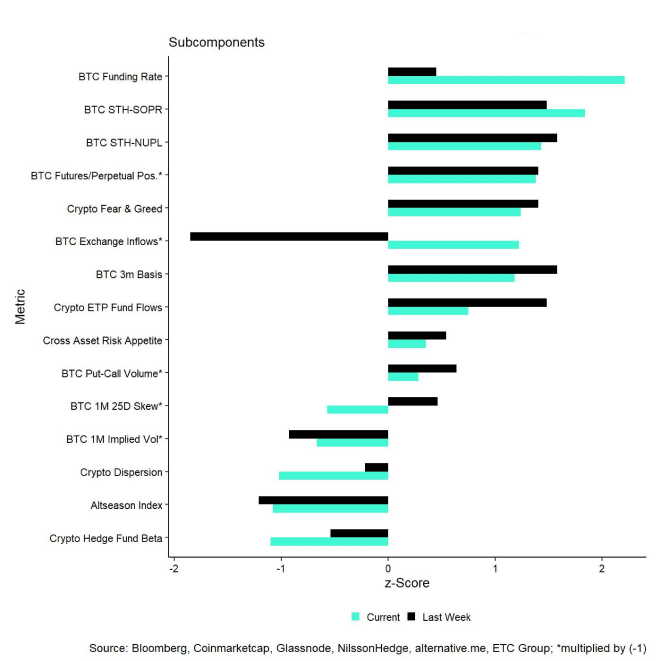
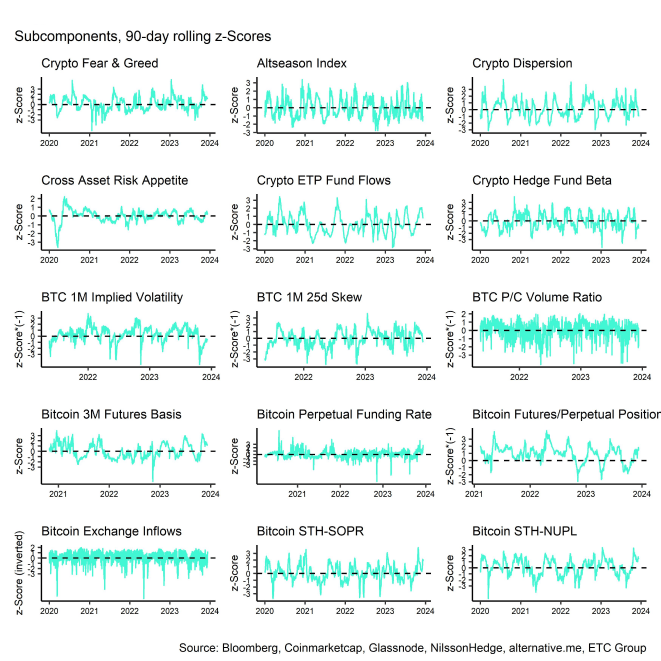
Our in-house Cryptoasset Sentiment Index has remained relatively elevated compared to last week and is still in positive territory. At the moment, 10 out of 15 indicators are still above their short-term trend.
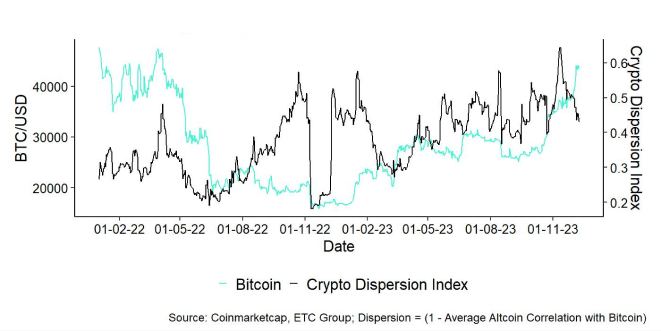
Compared to last week, we saw major reversals to the downside in the Crypto Dispersion Index and the BTC 25-delta 1-month option skew.
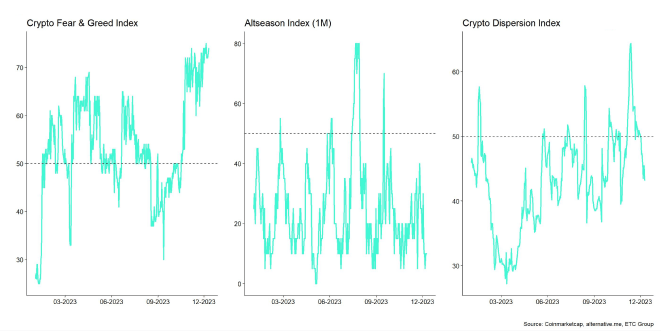
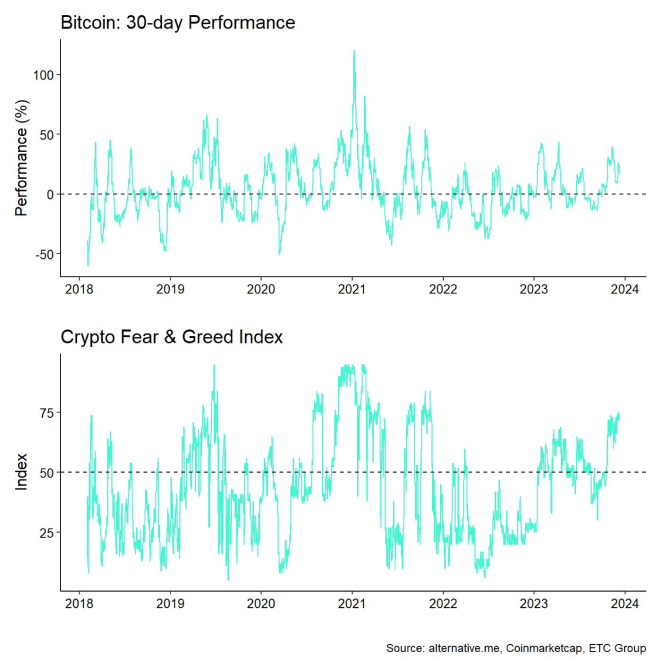
The Crypto Fear & Greed Index also still remains in "Greed" territory as of this morning.
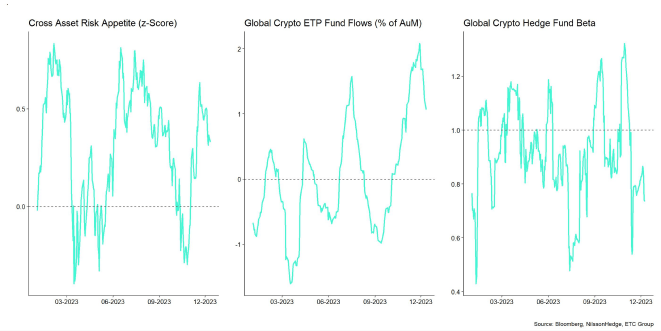
Meanwhile, our own measure of Cross Asset Risk Appetite (CARA) has recently declined somewhat, signalling a decrease in risk appetite in traditional financial markets. However, the indicator still remains in positive territory overall.
Performance dispersion among cryptoassets has declined somewhat compared to last week but continues to be relatively high. In general, high-performance dispersion among cryptoassets implies that correlations among cryptoassets have decreased, which means that cryptoassets are trading more on coin-specific factors and that diversification among cryptoassets is high.
At the same time, altcoin outperformance has picked up significantly compared to the week prior, with 50% of altcoins outperforming Bitcoin on a weekly basis. In general, high altcoin outperformance tends to be a sign of high risk appetite within cryptoasset markets.
Flows
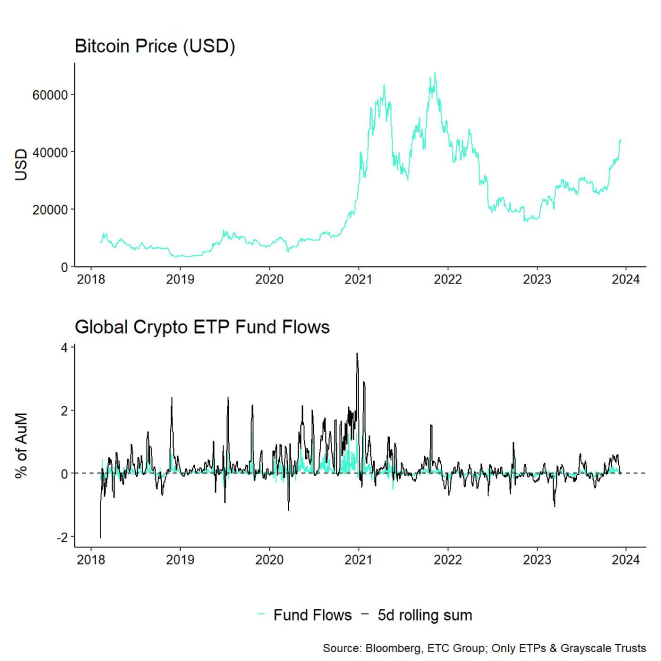
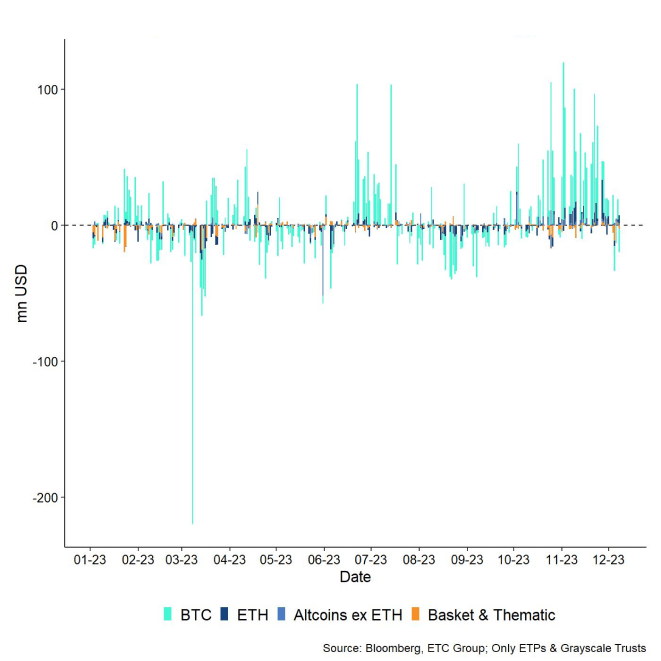
Last week, we saw the first week of net outflows from cryptoasset ETPs since early October.
In aggregate, we saw net fund outflows in the amount of +18.2 mn USD (week ending Friday).
Most of these outflows focused on Bitcoin ETPs (-13.1 mn USD) and thematic & basket ETPs (-18.4 mn USD) while both Ethereum ETPs and altcoin ex ETH ETPs managed to attract net inflows of +5.8 mn USD and +7.5 mn USD, respectively.
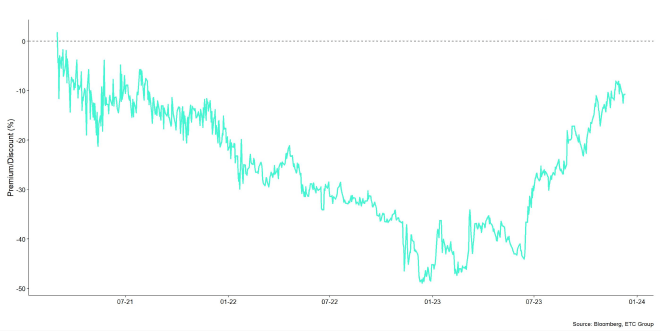
Meanwhile, the NAV discount of the biggest Bitcoin fund in the world - Grayscale Bitcoin Trust (GBTC) – has declined somewhat last week to around -10.7%. In other words, investors are assigning a probability of around 89% that the Trust will ultimately be converted into a Spot Bitcoin ETF.
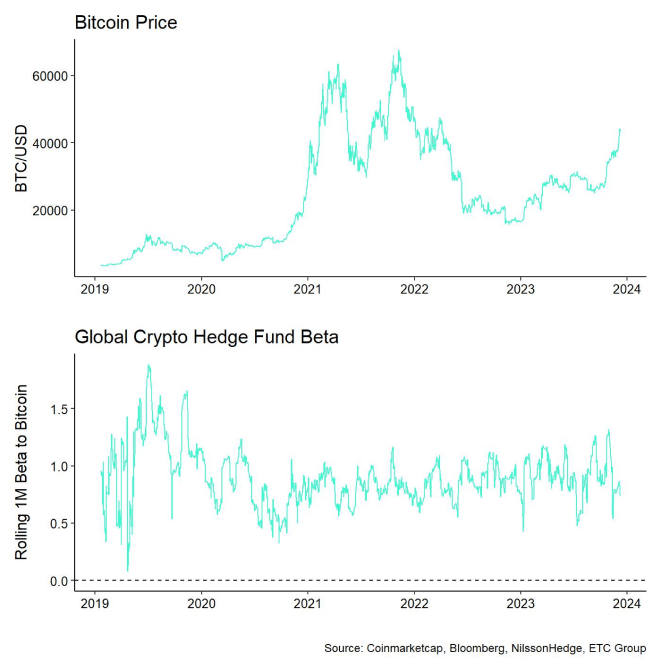
Besides, the beta of global crypto hedge funds to Bitcoin over the last 20 trading remains low at approximately 0.8, implying that global crypto hedge funds still remain under-exposed to Bitcoin market risks.
On-Chain
The market remains overall in a strong profit environment which means that some investors might already be inclined to take profits on their positions. At the time of writing, 88.3% of BTC addresses are in profit while 77.6% of ETH addresses are in profit according to data provided by Glassnode. These percentages are close to the highest readings year-to-date.
In fact, profit-taking activity by bitcoin investors has picked up as we approached the recent highs in bitcoin of 45k USD, especially among short-term holders (i.e. those with a holding period of less than 155 days). Short-term holders' transfers of BTC in profit to exchanges has reached the highest level since July this year, recorded last week on Monday. This has certainly held back the current rallye a bit due to increasing selling pressure. Short-term holder Spent Output Profit Ratio (STH-SOPR) has also increased significantly, indicating an increased level of spending (in profit) by short-term holders.
Although profit-taking remains dominated by short-term holders, long-term holders (holding period > 155 days) have also increased their transfers of profitable coins to exchanges. We are currently observing a structural increase in long-term holders' exchange transfers and spending which could be a hindrance to further price increases in the short-term.
However, on a positive note, we are not observing an increase of older coins being spent which would be a clear indication of a larger price correction. For instance, coin days destroyed (CDD) for BTC remains near year-to-date lows which implies that it's mostly profit-taking of younger coins that is taking place at the moment.
BTC whale deposits to exchanges have also not picked up meaningfully either. Whales are defined as network entities (cluster of addresses) that hold at least 1,000 BTC.
Although there was evidence for a larger whale transfer of ETH to Kraken last week, overall, ETH net exchange inflows remained fairly muted.
However, overall exchange balances for bitcoin have clearly picked up, implying a net inflow of coins to exchanges over the past week. More specifically, around +14k BTC have flown into exchanges on a net basis according to data provided by Glassnode. This will likely exert some downside pressure on prices in the short term.
Derivatives
Aggregate open interest across both BTC futures and perpetuals continued to hover sideways last week, although there were some significant futures short liquidations recorded on Monday and Tuesday of last week totalling more than 100 mn USD according to Glassnode data.
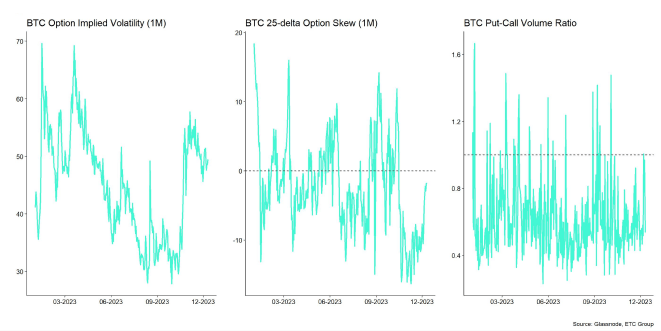
In contrast, BTC option open interest increased significantly by around +23k BTC tied in option contracts across all exchanges according to data provided by Glassnode. In this context, there was a significant increase in relative put-buying judging by the increase in put-call open interest ratio that increased from 0.45 to 0.50. So, option traders increased their downside protection over the past week.
This observation is also supported by the fact that 25-delta BTC option skews increased as the spread between delta-equivalent calls and puts narrowed significantly. More specifically, the average 1-month 25-delta BTC option skew on Deribit increased from -8.6% p.a. at the beginning of last week to only -1.7% p.a. recorded yesterday. This implies increased relative demand for puts vis-à-vis calls as well. However, overall ATM implied volatilities did not change significantly compared to the week prior.
At the time of writing, the large majority of BTC call option open interest for contracts expiring at the end of December sits at 40k USD. The “max pain theory” would suggest that we converge to this price in the short term.
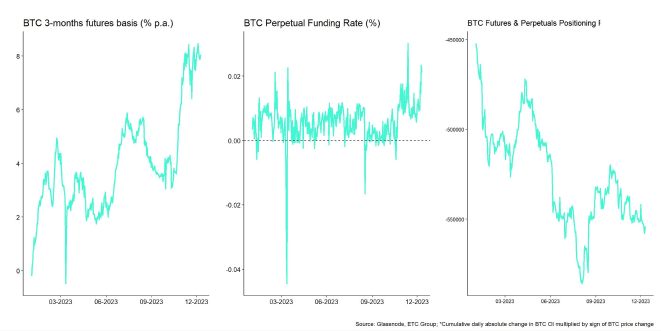
Meanwhile, the 3-months annualized rolling basis in BTC futures has remained fairly flat throughout the week and is currently at around 8.0% p.a. according to data provided by Glassnode. Bitcoin perpetual funding rates also still remain positive across various exchanges, even despite the most recent pull-back as of this morning. So, this implies that the current pull-back is probably not exhausted in terms of selling, yet.
Bottom Line
- Cryptoassets outperformed last week, supported by a significant repricing in monetary policy expectations and short futures liquidations
- Our in-house “Cryptoasset Sentiment Index” still remains relatively elevated
- However, cryptoassets have recently pulled back as bitcoin investors are increasingly taking profits
Appendix
Important information:
This article does not constitute investment advice, nor does it constitute an offer or solicitation to buy financial products. This article is for general informational purposes only, and there is no explicit or implicit assurance or guarantee regarding the fairness, accuracy, completeness, or correctness of this article or the opinions contained therein. It is advised not to rely on the fairness, accuracy, completeness, or correctness of this article or the opinions contained therein. Please note that this article is neither investment advice nor an offer or solicitation to acquire financial products or cryptocurrencies.
Before investing in crypto ETPs, potentional investors should consider the following:
Potential investors should seek independent advice and consider relevant information contained in the base prospectus and the final terms for the ETPs, especially the risk factors mentioned therein. The invested capital is at risk, and losses up to the amount invested are possible. The product is subject to inherent counterparty risk with respect to the issuer of the ETPs and may incur losses up to a total loss if the issuer fails to fulfill its contractual obligations. The legal structure of ETPs is equivalent to that of a debt security. ETPs are treated like other securities.


