The Institutional Investors Guide to Ethereum
How does ETH impact a 60/40 portfolio?
How does ETH impact a 60/40 portfolio?


Original Report available here.
Long-time subscribers of The DeFi Report (https://thedefireport.io/) know that we've been projecting the merger of DeFi and TradFi for some time now. Our thesis is that this process will play across two distinct phases:
Currently underway. In phase 1, regulated asset managers and financial service providers will begin offering customers access to new crypto-based financial products such as ETFs, SMAs, indices, tokenized securities, staking products, etc.
In phase 2 we expect the more agile incumbents to build “on top” of public blockchains and DeFi infrastructure - offering new financial services via familiar, regulated interfaces - while leveraging DeFi protocols and public blockchains under the hood. In this way, DeFi brings the tech. TradFi brings the distribution.
Not only can DeFi and TradFi win together, but investors that access these new financial products early (phase 1) could benefit from institutional adoption of the underlying tech that is poised to come later (phase 2).
It's safe to say that phase 1 is well underway with the approval and overwhelming success of the Bitcoin ETFs. And now it appears the market is turning its attention to a potential spot ETH ETF/ETP approval in the US.
Of course, ETH offers a native yield that investors could capture in a total return product - a feature of Ethereum that could make an ETF/ETP product even more successful than the Bitcoin ETF's.
But did you know that we already have a spot Ethereum Staking ETF/ETP in Europe??
In this report, we're breaking down the institutional investment case for Ethereum - with bonus coverage on the features of newly regulated products already available to European investors.
Topics covered:
Disclaimer: Views expressed are the author's personal views and should not be taken as investment or legal advice.
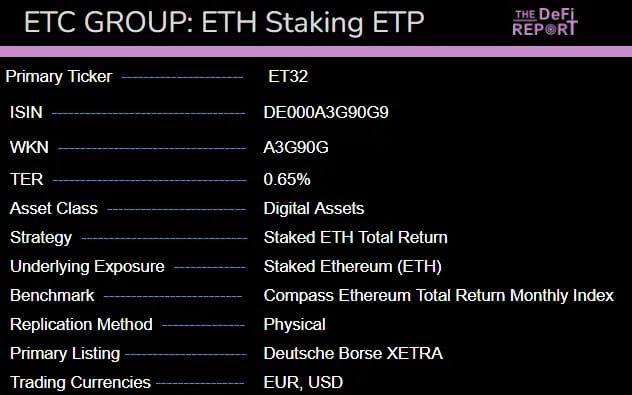
This issue of The DeFi Report is powered by ETC Group. If you're interested, you can learn more about their Total Return Spot ETH Staking Product here: ET32.
Please note that the products mentioned are available to investors in Europe but limited to professional investors in the United Kingdom. To find out if one or more products are suitable to your investor profile and available in your jurisdiction, please consult with an investment professional.
Let's go.
The Product: Ethereum sells block space - which can be thought of as immutable accounting entries. The market values its block space due to Ethereum's network effects, security, and smart contract functionality enabled by its global, open-source computing platform, ledger, and operating system.
We can think of Ethereum as an online marketplace that provides a secure platform for executing global commerce. The businesses within this online marketplace are made up of batches of smart contracts that autonomously execute business logic.
In essence, the businesses (smart contracts & protocols) building “on top” of Ethereum leverage the network's secure computing, execution, and accounting system to outsource operating and capital expenses. In doing so, developers can create new products and services that can natively connect 8 billion people globally. This concept is similar to Facebook or Google leveraging internet protocols such as TCP/IP or SMTP to deliver internet services to users globally.
Ethereum's global network of 967k1 + validators secures the network while ensuring that the rules of the global, online marketplace are followed. They also maintain the ledger - which immutably records all economic events and transfers of data that occur within the marketplace.
Users interact with each other and access services via smart contracts and digital wallets (mobile app or browser extension). In doing so, network usage fees are paid in the native asset, ETH - which accrues to the distributed global network of validators who provide services to the network by approving transactions. $2.6 billion in network usage fees were paid over the last year.2
In addition to being the most secure public blockchain,3 Ethereum has the strongest network effects across the industry. Investors need to understand the relationship between two key laws that historically have driven technology markets toward dominance by a small number of entities.
The first is Metcalf's Law - which states that the financial value of a network is proportional to the square of the number of connected users of the system.
The second “law” states that the marginal cost of software is effectively zero. This means that if you're an incumbent in the market and have already spent the sunk cost to develop high-quality software, you can add new members to your network by selling your product at a very low price - since it costs you nothing to make one more copy.
Ethereum's network value grows as the number of connected users increases - which is driven by a foundation of developers, developer tooling, programming languages, the EVM standard, token standards, wallets, liquidity, applications, scaling infrastructure, and venture capital.
As the largest smart contract network in crypto today, Ethereum controls a roughly 80% market share in terms of revenues, total value locked (assets under mgmt), market cap, applications, etc.4 Because Ethereum is a network model, we think it could be poised to become a global monopoly (that nobody can control and anyone can access).
We monitor Ethereum's network effects from both a quantitative and qualitative perspective. Below is an overview of some of the key performance indicators and metrics we track to measure progress and adoption.
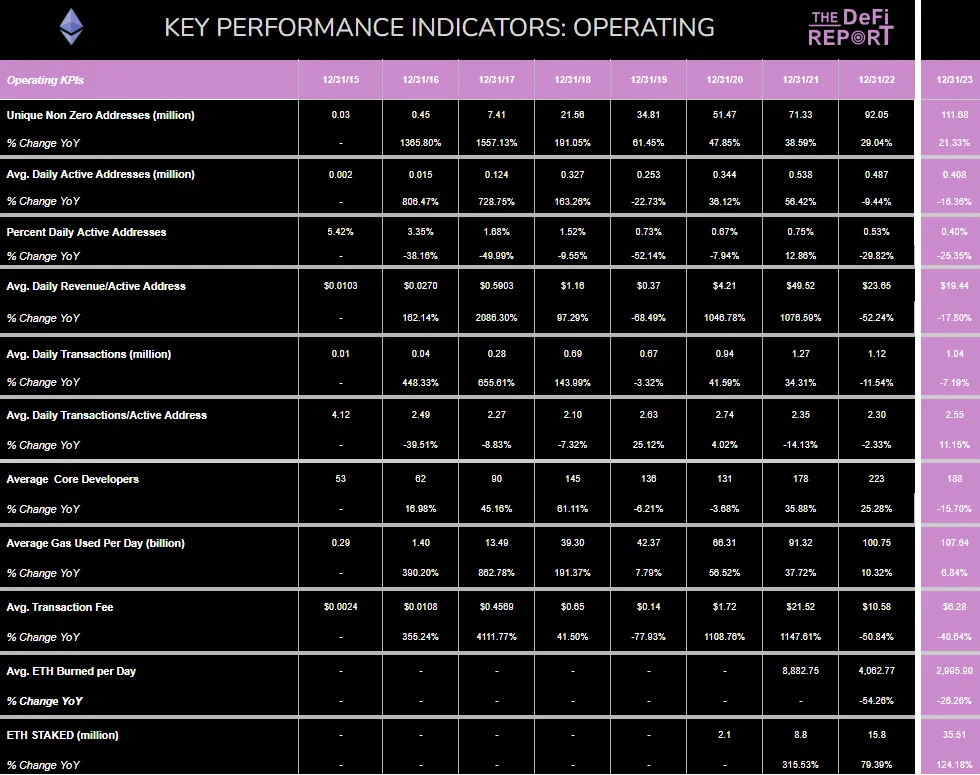
A brief summary of some important KPIs in terms of compound annual growth rates since December 2017:
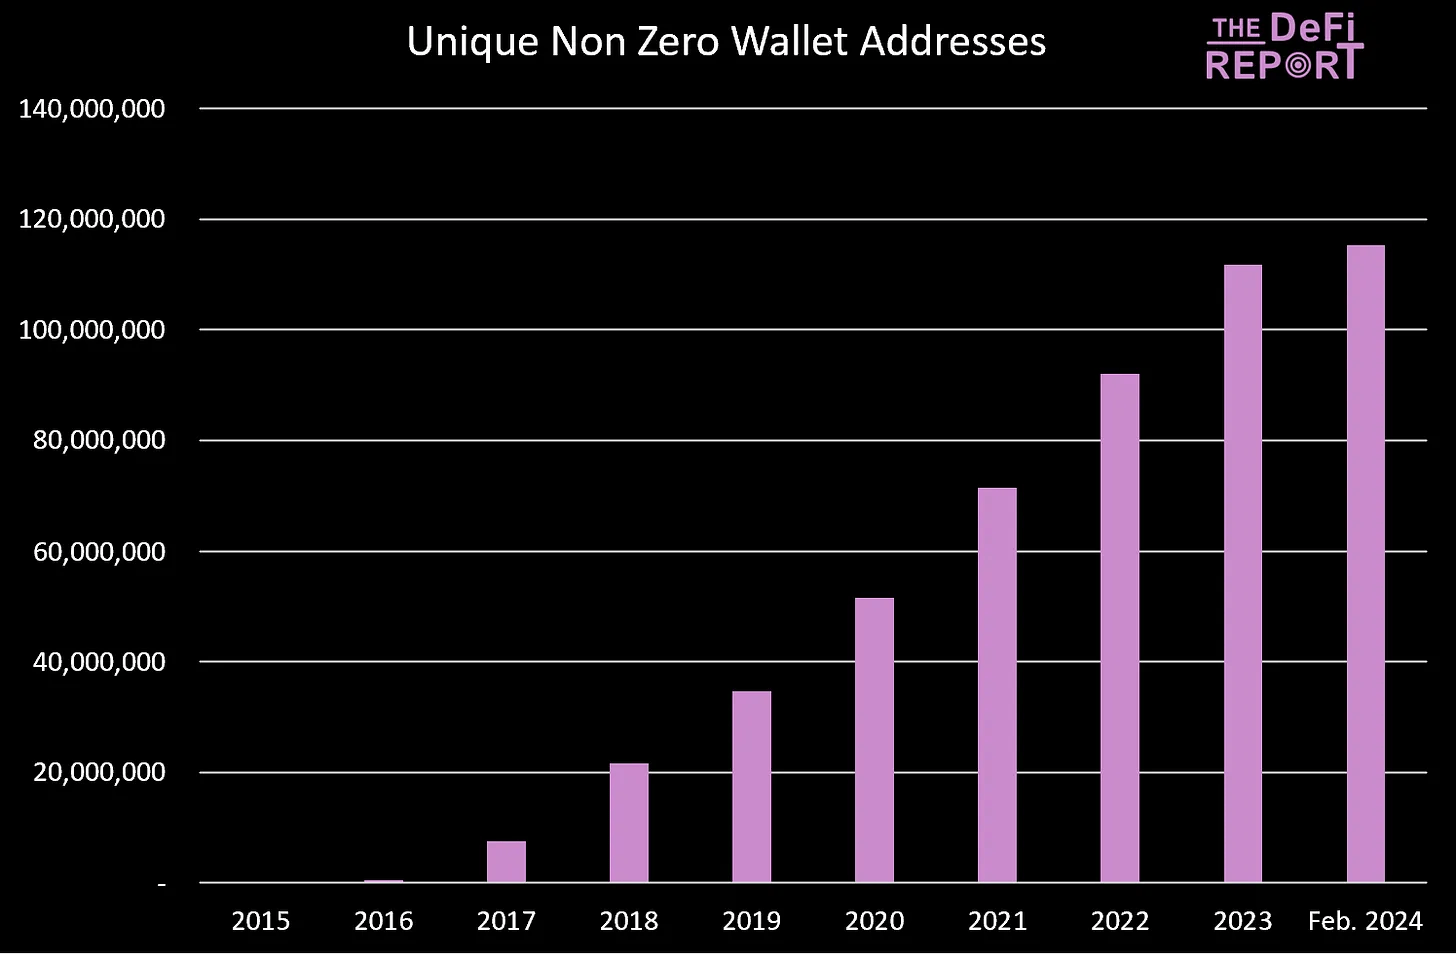
Ethereum is 8 years old and currently has over 115 million non-zero wallet addresses - a proxy for users on the network. For reference, the internet had about 147 million users in 1998 - 15 years after its inception.5
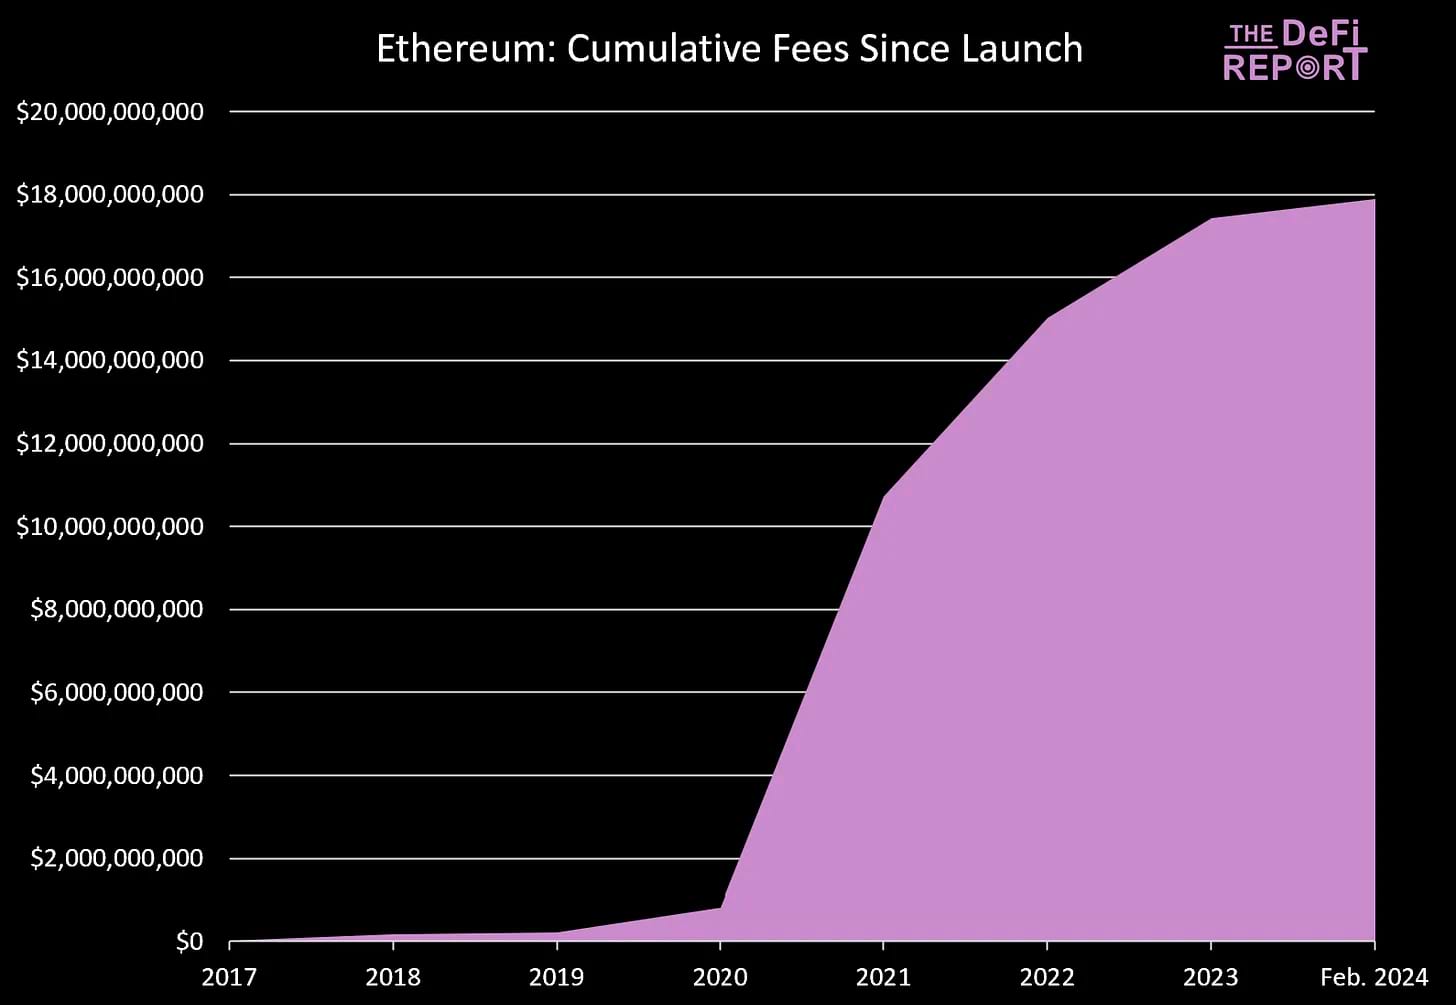
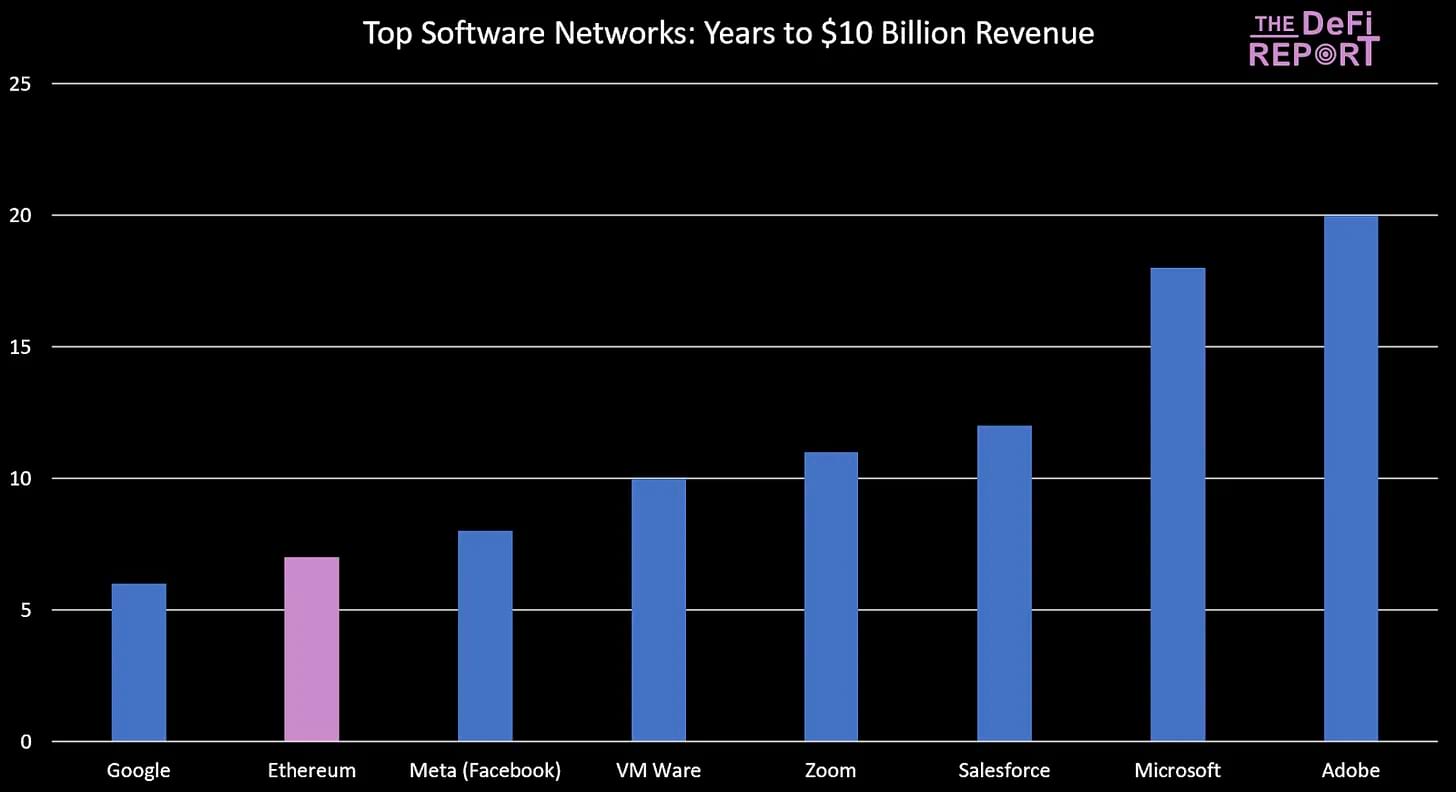
Below we can see how the top smart contract network stacks up against some of the largest technology networks from web2. Only Google reached $10 billion in fees faster than Ethereum.
Token Economics & Ethereum's “Illiquid Supply”
In the following section, we want to highlight the potential impact of two important changes to Ethereum's token economics in the last cycle - because they could play a significant role in Ethereum's valuation in the next cycle.
Implemented on August 6, 2021, EIP1559 changed Ethereum's transaction fees. Notably, the Ethereum Foundation created a new dynamic “base fee” for transactions to be included in blocks. This new base fee is burned (accruing value to passive holders of ETH), with the remaining user fee accruing to Ethereum validators.
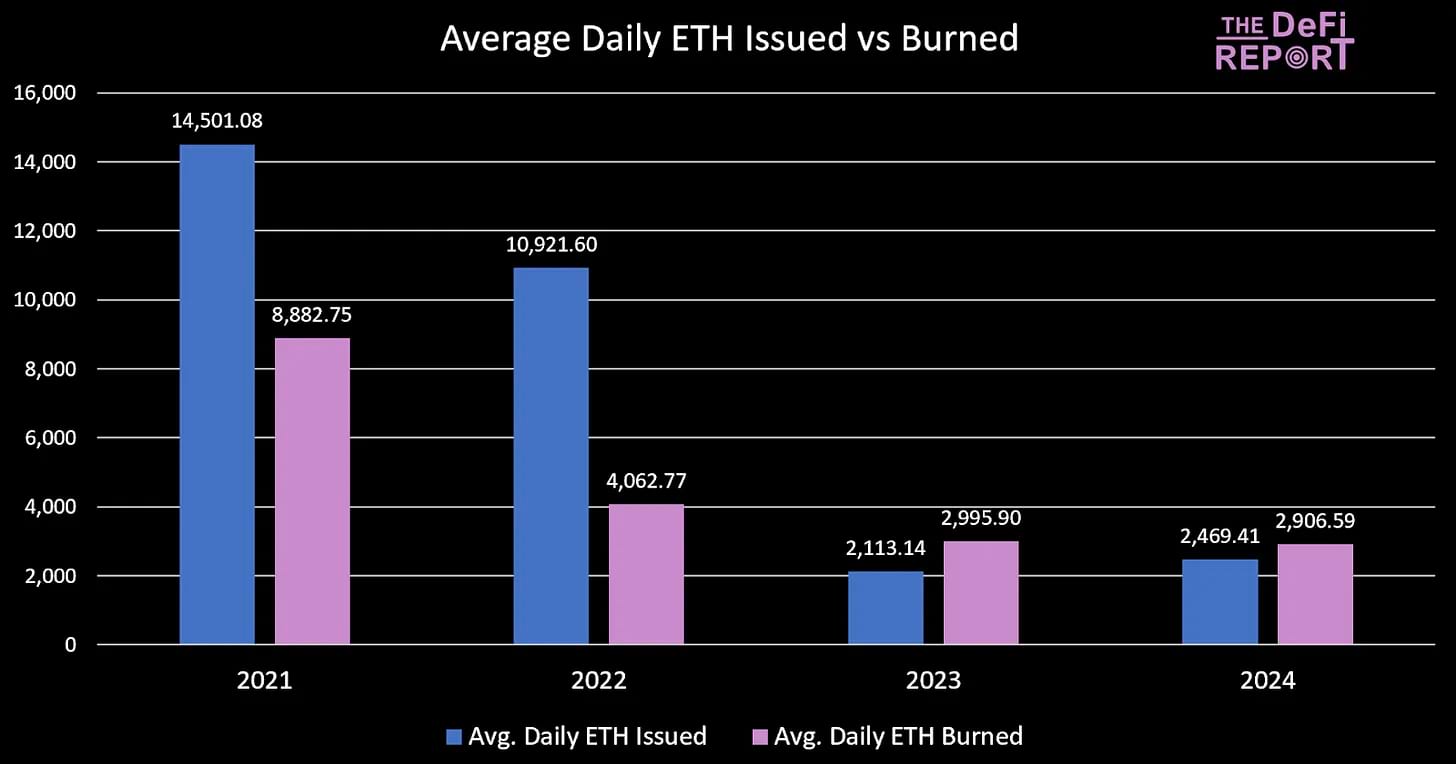
As we can see in the chart above, ETH burned per day (pink) was averaging 8.8k/day in 2021. This was during the peak of the last bull run - when there was more onchain activity. As the crypto winter set in during 2022 and 2023, we saw a decrease in ETH burned due to less demand for Ethereum's block space. However, the drop in transactions (onchain activity) is not perfectly correlated with the drop in ETH burned. For example, a 9.4% drop in transactions from 2021 to 2022 resulted in a 54% reduction in ETH burned. We can see this visualized below:
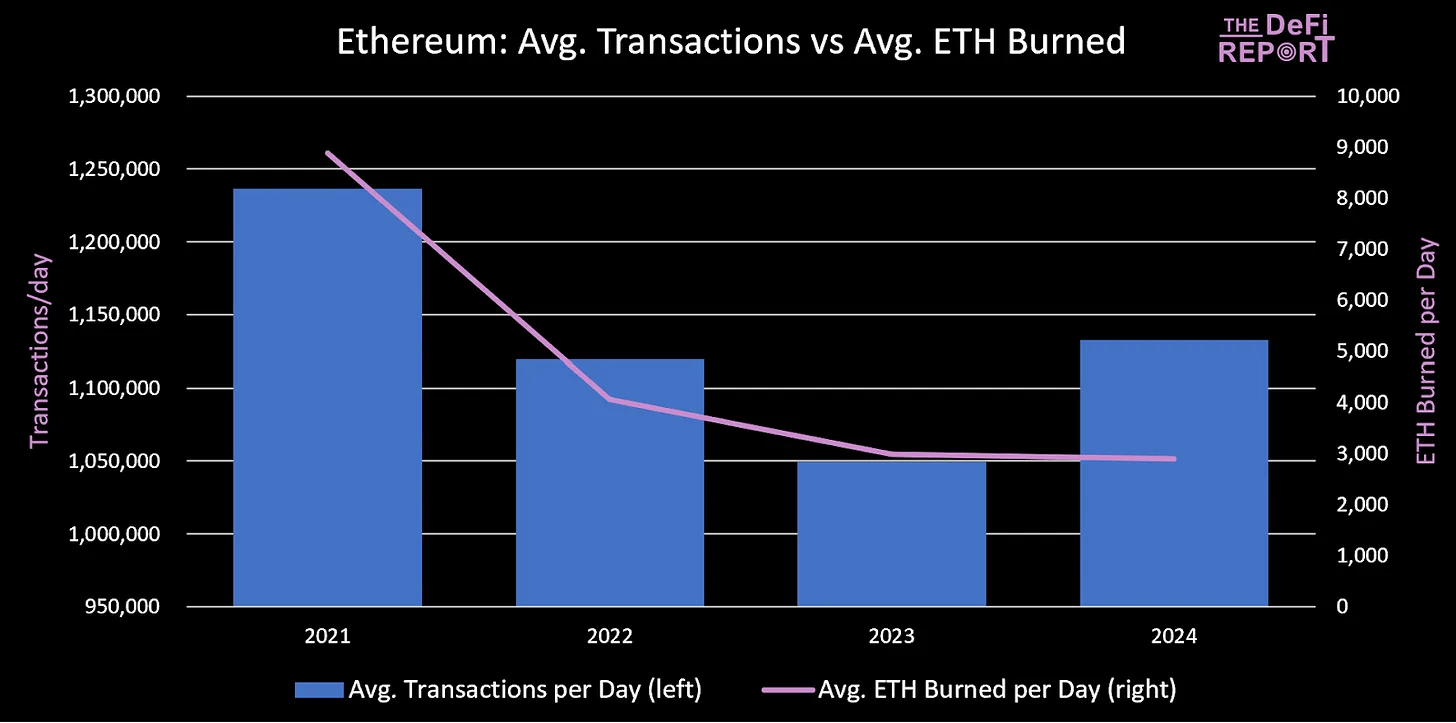
The amount of ETH burned is not perfectly correlated with the number of transactions on the network. Rather, ETH burned will ramp up when the timeliness of transactions is urgent and there is a bottleneck of transactions. This results in ETH users bidding up the transaction fees (and the base fee) - which can result in a disproportionate amount of ETH being burned during periods of high demand - which we expect to see in the next cycle.
The second major change to Ethereum's token economics occurred when the network moved from a proof of work consensus to proof of stake. In doing so, token issuance has dropped approximately 80%. We can see this below. To be clear, new issuance of ETH is offset by “burned” ETH. In 2023, this resulted in network inflation of -.28%.
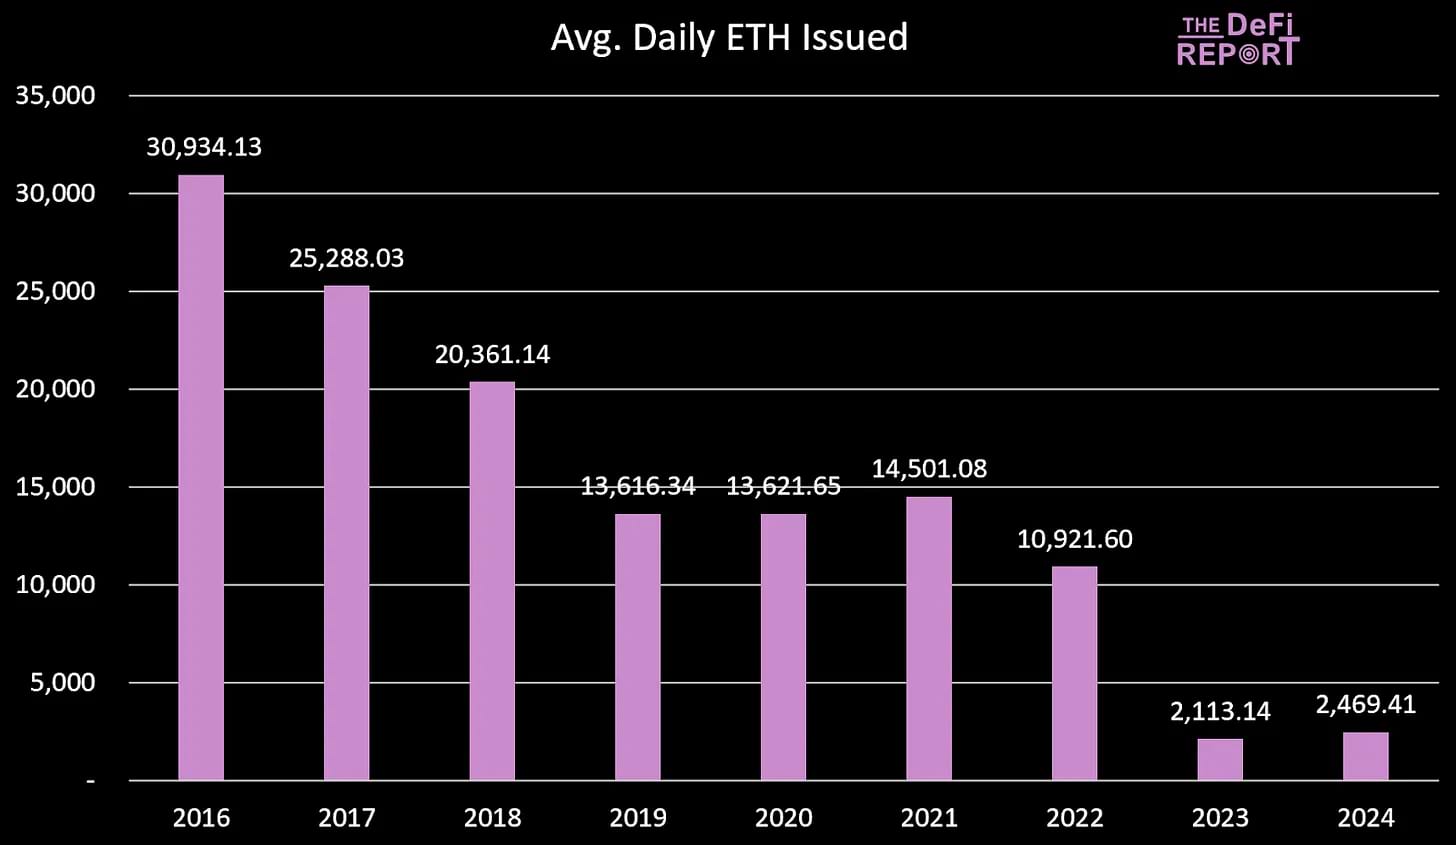
The Ethereum Foundation was overpaying its proof-of-work miners - largely because miners have more overhead than validators such as higher hardware costs, energy costs, and physical real estate costs. When Ethereum shifted to proof of stake, it reduced the network's security expense by 80%, turning the network profitable for the first time in 2023 - despite a drop in onchain fees compared to 2022.
In combination, these changes made Ethereum's token issuance deflationary in 2023 - during a crypto winter when there was less onchain activity.
In a bull run, we think these changes *could* kick off some intense reflexivity leading to potential price volatility to the upside.
In addition to these important changes to Ethereum's token economics via EIP1559 and The Merge, it's important to understand how ETH is used onchain, and the % of the circulating supply that could be seen as “illiquid.”
For example, below is a visual of the ETH balance on exchanges dating back to 2020.
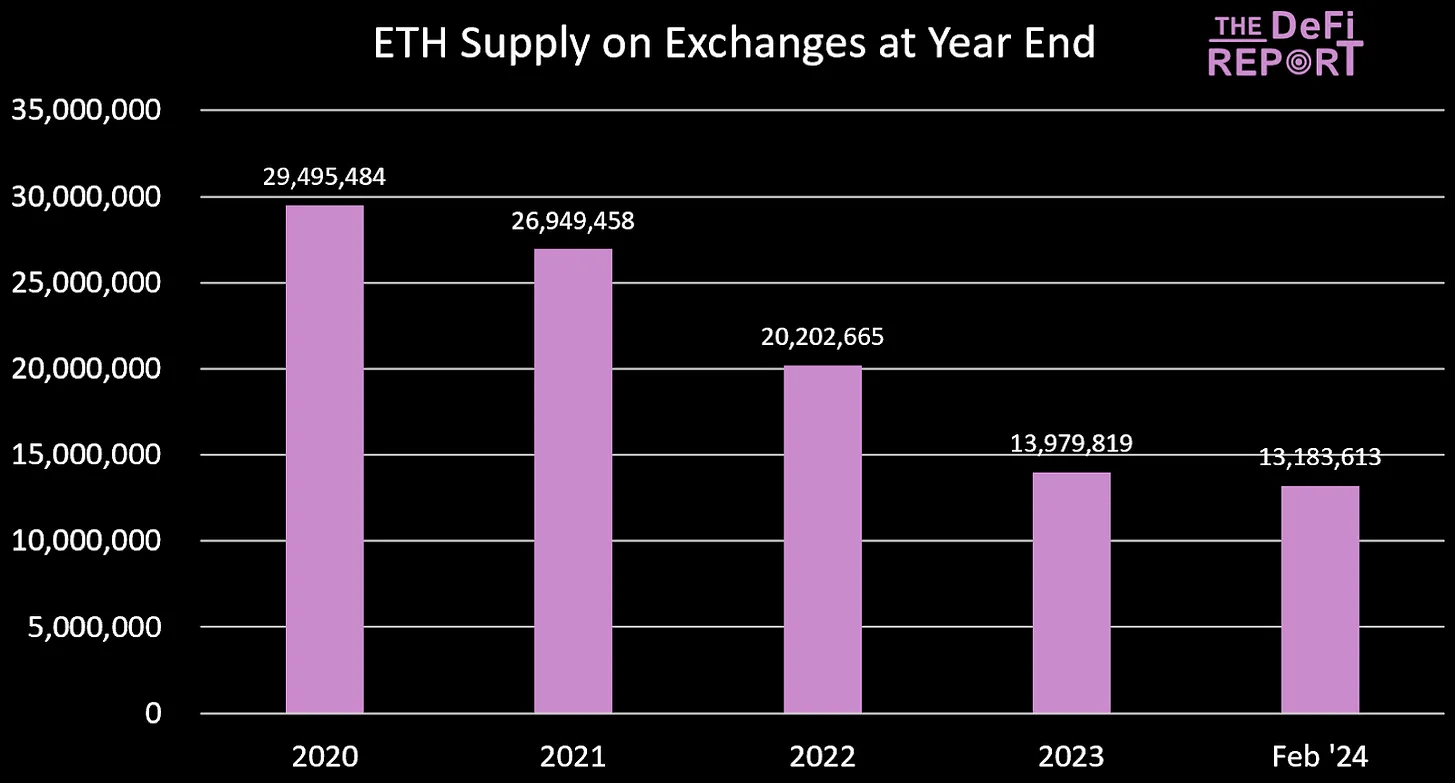
As we can see, there is currently less than half of the ETH supply on exchanges than there was just 3+ years ago.
So where is all this ETH going? We think there are two places: 1) DeFi/staking, and 2) into cold storage custody.
Here is a view of the amounts that have been moved into DeFi over the last few years:
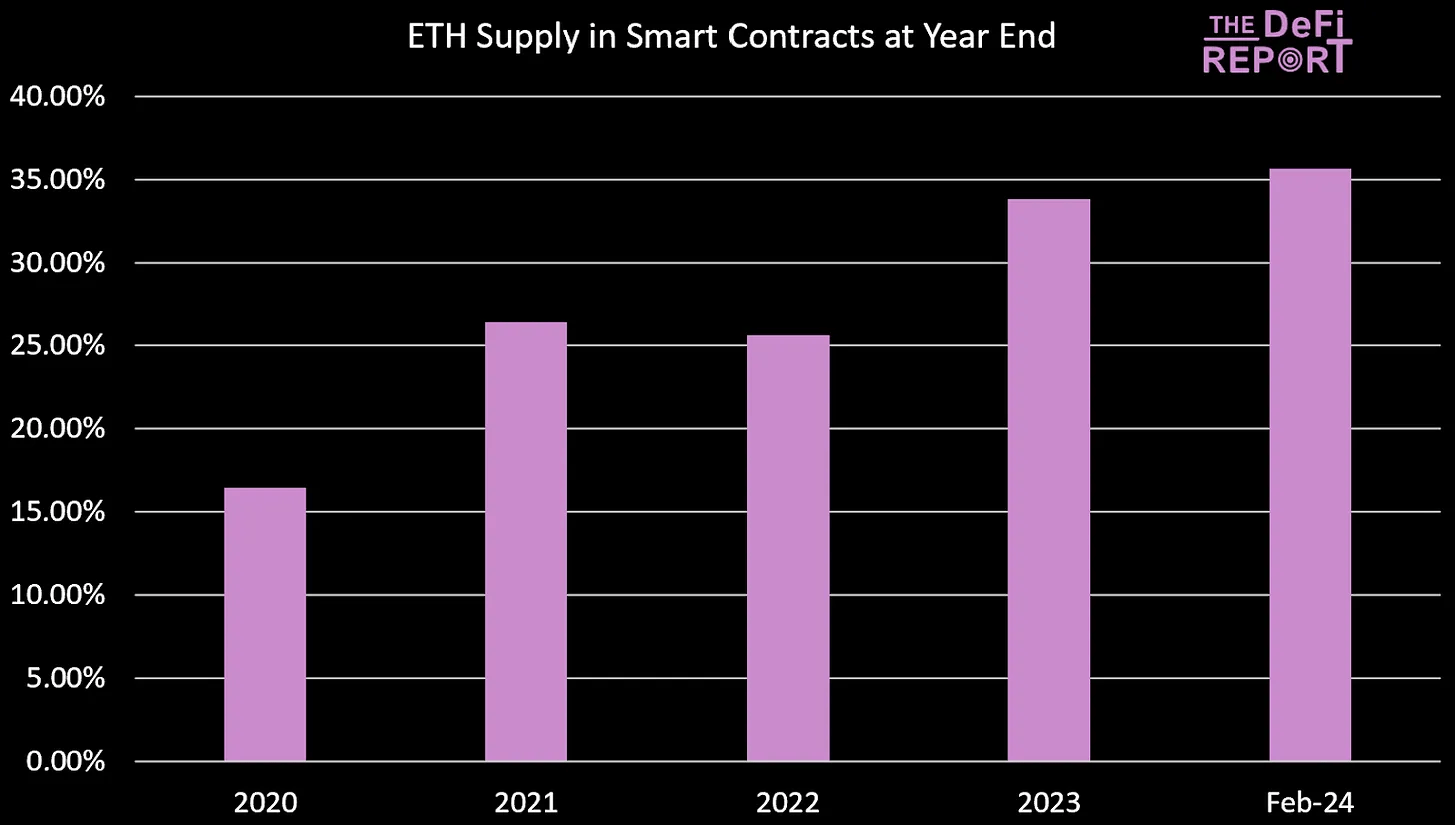
As we can see, over 35% of the circulating supply of ETH is currently held in smart contracts onchain (earning yield) - pointing to the utility of ETH as a productive asset. This also results in more supply that could be seen as “illiquid” relative to the last cycle.
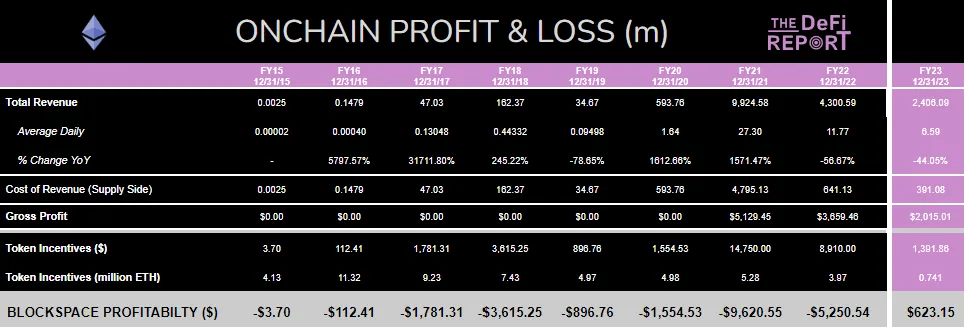
A quick review of the above financials may have you wondering how the network was profitable in 2023 despite revenues being down 44% compared to 2022. The answer relates to what we covered in the token economics section and the 80% reduction in token incentives after the merge to proof of stake. Note that our P&L tracks purely onchain data.
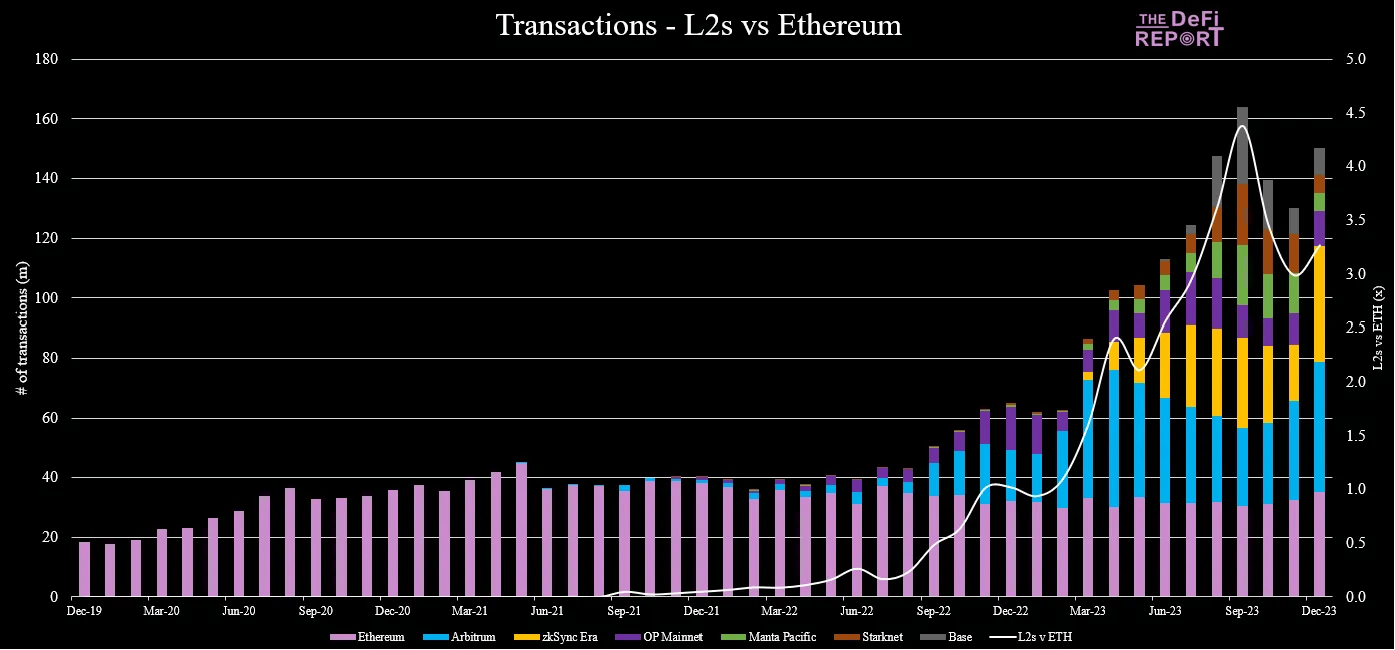
It's important to recognize that Ethereum is scaling in a modular architecture. Said another way, Ethereum is scaling as a “network of networks,” similar to the internet.
We can observe this in the chart above. The pink lines at the bottom represent Ethereum's transactions per day at the base layer 1 level. Beginning in 2021, we can see that layer 2 networks burst onto the scene - and now represent over 3x the number of transactions on the L1 level.
Layer 2 networks inherit the security guarantees of Ethereum while reducing transaction costs and increasing transaction throughput. In essence, they provide execution services to developers at the app level by “reselling” Ethereum's block space. This business model means that L2s pay transaction fees to Ethereum for settling their data on the L1. For example, below are the top L2s on Ethereum and the fees they've paid to Ethereum's validators over the last year:
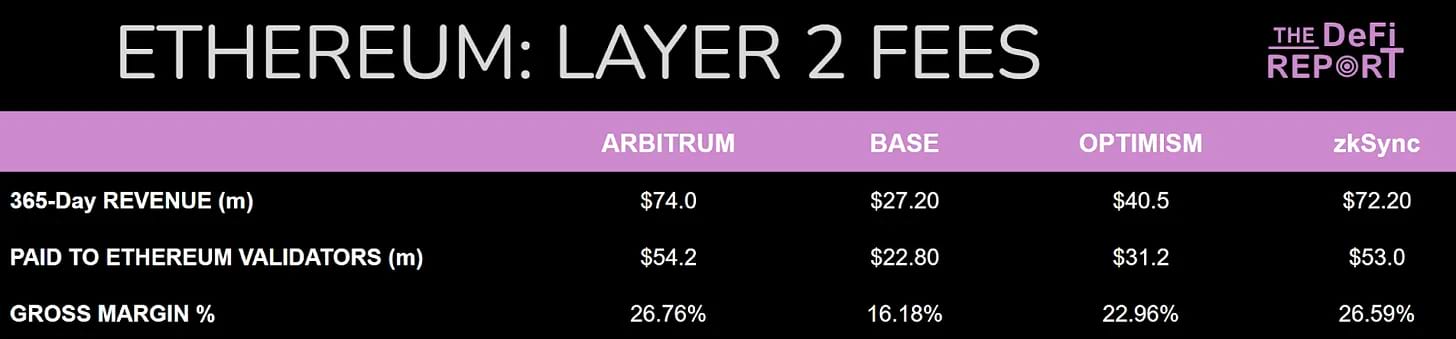
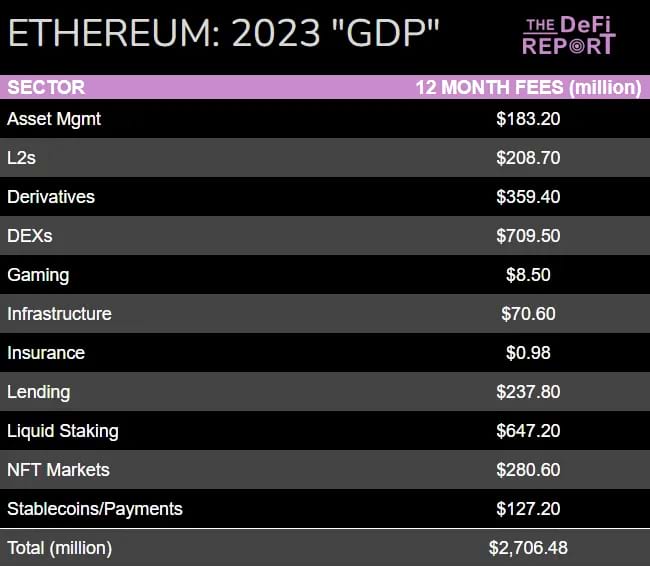
One way to compare Ethereum relative to alternative smart contract networks is with “GDP” analysis. In this case, we quantify and forecast the economic output, or GDP of the network. The GDP of a blockchain network is the sum of all the revenues produced by the applications built “on top” of the L1. Ethereum's 2023 GDP was $2.7 billion across the above sectors - comprised of the top 100 projects per Token Terminal data. With each passing cycle, we expect to see new categories added to “GDP.” In the coming “social,” or “prediction markets” could make this list as well as something we cannot foresee today.
The phases of a technological revolution:
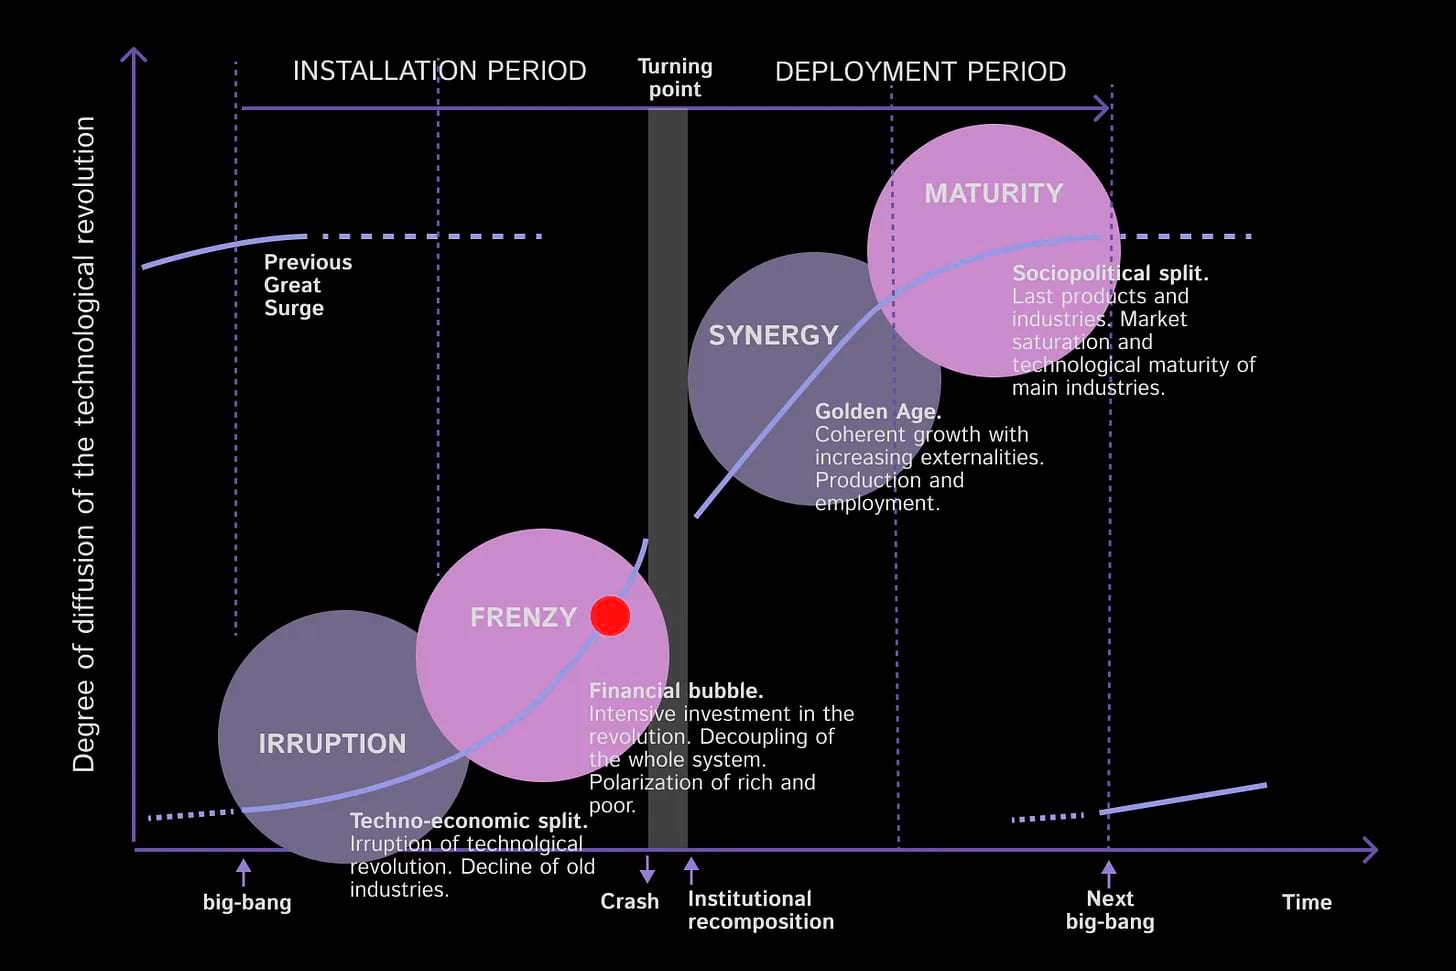
Per the framework laid out in Carlota Perez' Technological Revolutions and Financial Capital, revolutionary technologies go through 4 distinct phases as they are implemented and deployed. We've seen this play out through the industrial revolution, the age of steam and railways, the age of steel and electricity, the age of oil, the age of the automobile & mass production, and the age of information and telecommunications.
The innovation on and around Ethereum (and public blockchains broadly) has been following an eerily similar pattern.
In our opinion, blockchains are currently on the cusp of The Turning Point (red dot above). 2022/2023 was the “cleansing” period, with turning points typically marked by regulatory enforcement. Court cases. And ultimately new legislation.
On the other side of the Turning Point comes the “deployment period.” This is when the market has achieved consensus regarding the best ways to use and regulate the new technology - and when true S-Curve growth typically occurs.
There are several risks to consider given the nascent stage of Ethereum and the immense competition in the space:
As a multi-function asset, ETH has many differences (and some similarities) with traditional assets such as equities, bonds, real estate, etc. We demonstrate this by analyzing how it fits into all three asset classes from Robert Greer's Super Asset Class Framework:
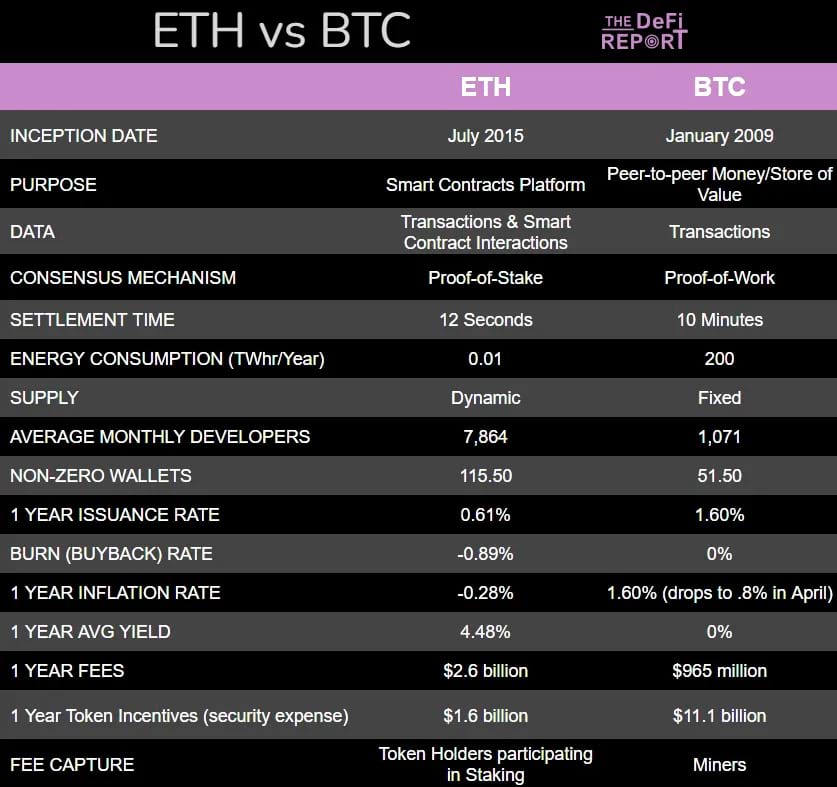
While the market may view Bitcoin as a competitor to Ethereum, we do not see it this way. The two networks are fundamentally different and will ultimately serve different use cases. Bitcoin is trying to be “internet money.” With the digital gold narrative taking hold, we believe this is the primary use case for Bitcoin. Of course, we are now observing new innovation on Bitcoin such as Ordinals and L2s/DeFi. However, we think Ethereum has already proven itself to be the dominant smart contract network due to the expressiveness of its programming languages, and its vast network effect.
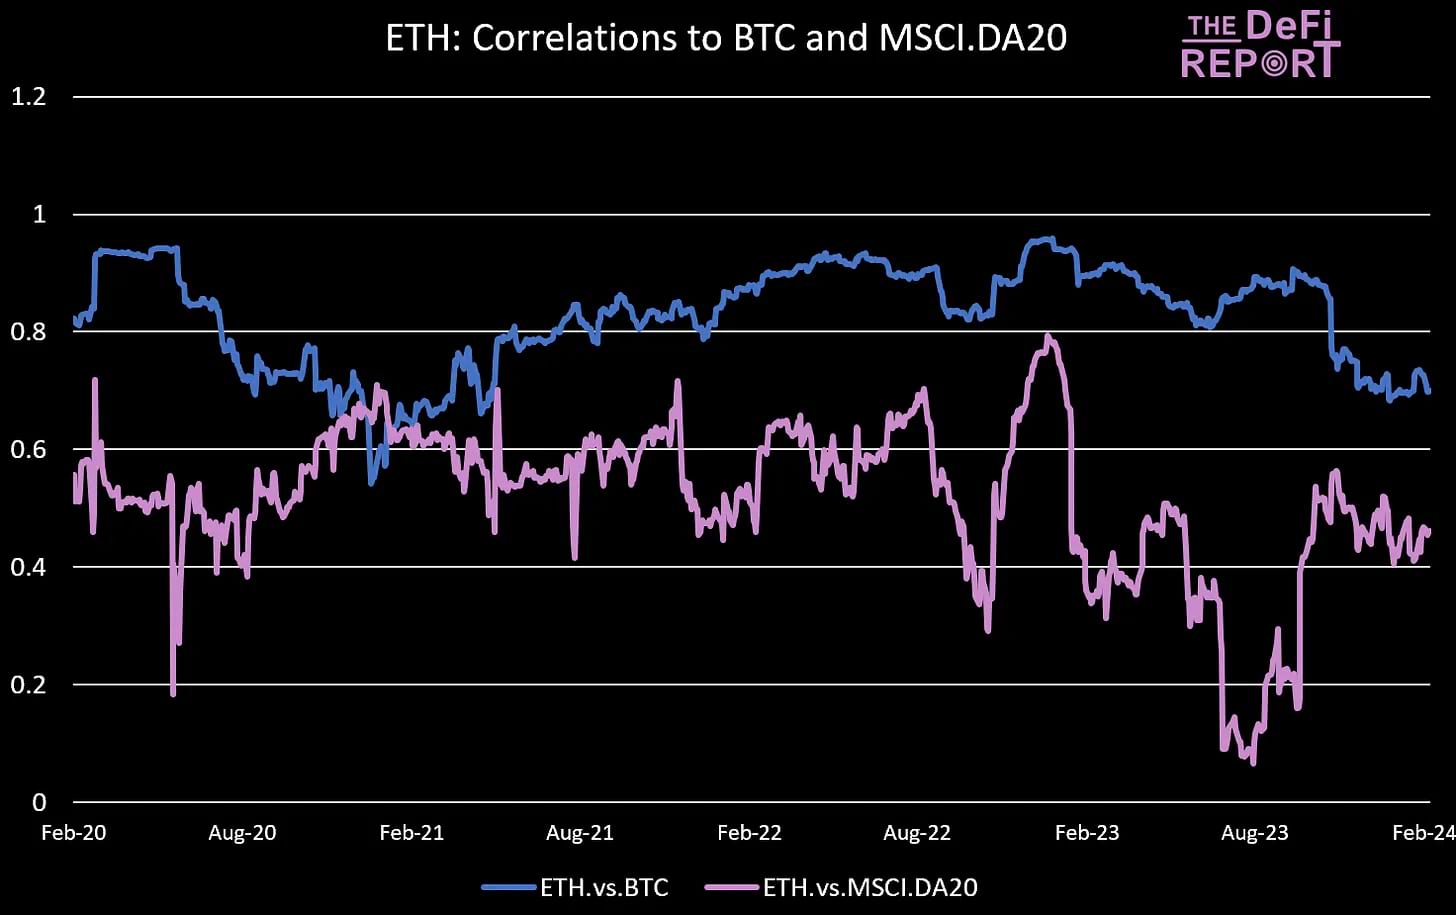
ETH is more correlated to other crypto assets such as Bitcoin, but less correlated with the MSCI.DA20 - a capped market cap-weighted index of the top 20 digital assets offered by ETC Group.
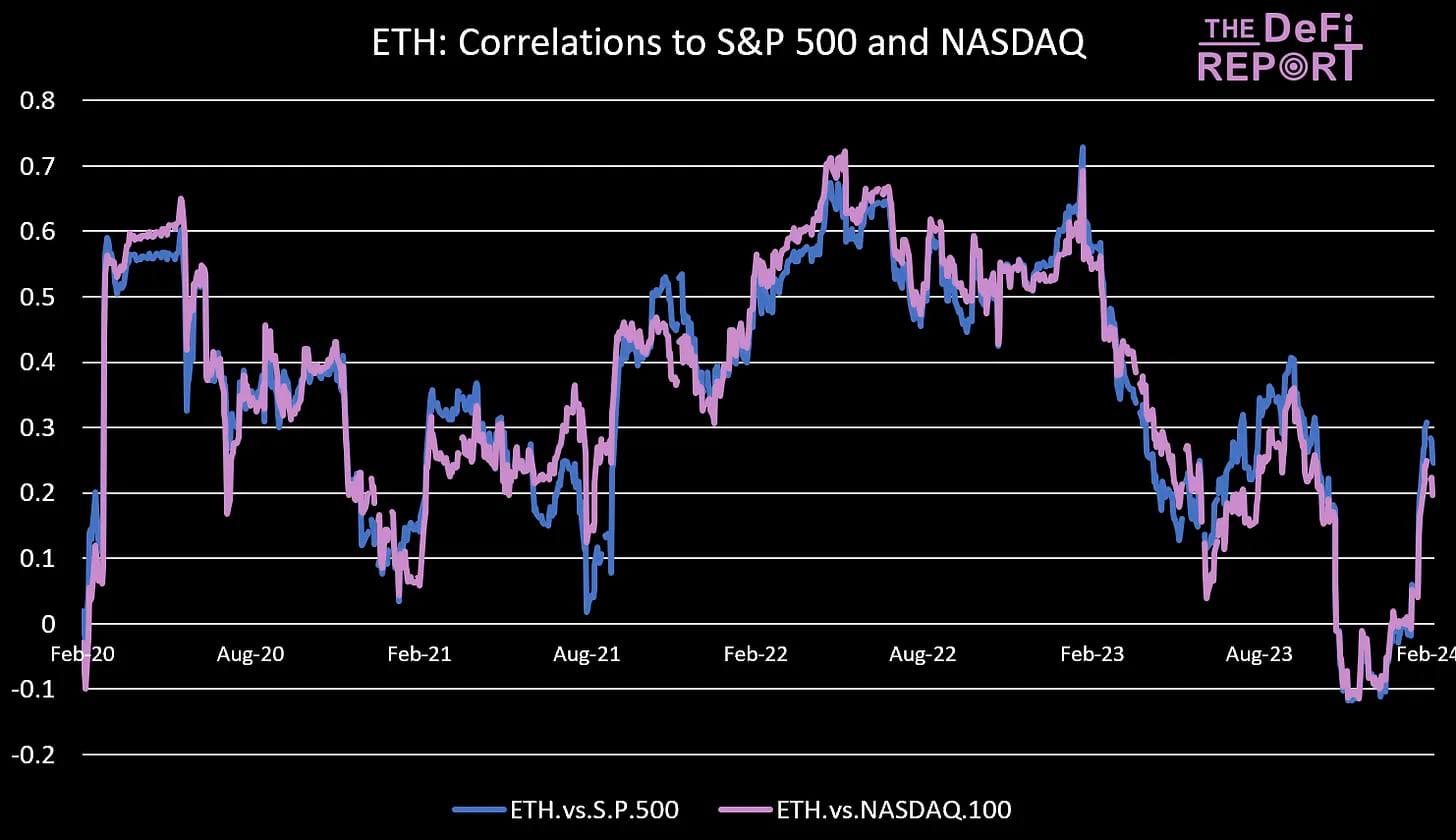
But it is generally uncorrelated to US equities…
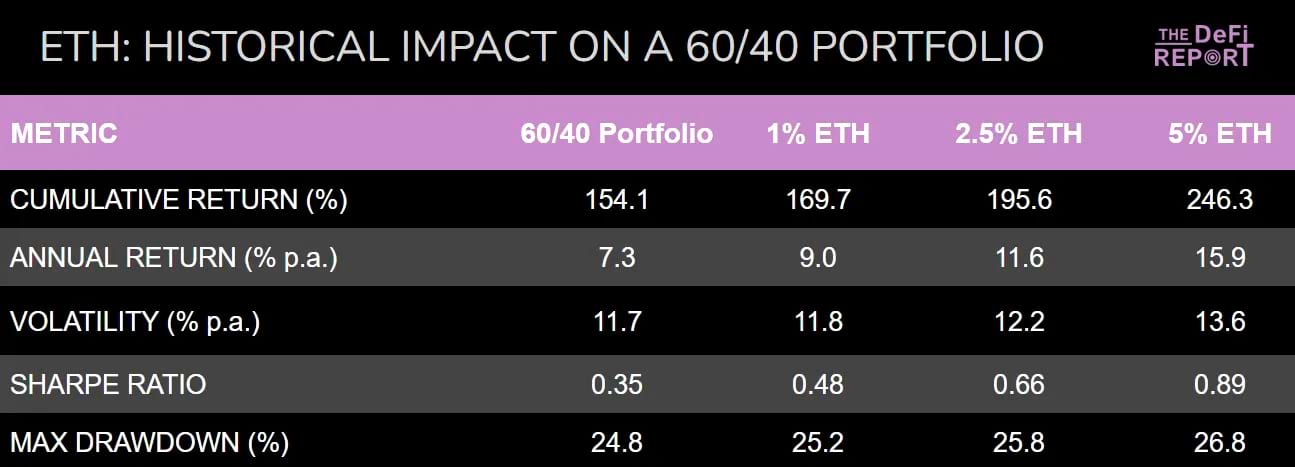
An allocation to Ethereum can significantly increase risk-adjusted portfolio returns. Noting that past performance is not indicative of future returns, below is the historical impact of a 1%, 2.5%, and 5% ETH allocation to a 60/40 portfolio.
As we can see, a 2.5% allocation to ETH increased annual returns by over 6% and cumulative returns by over 36.2% - while increasing volatility by just .5%.
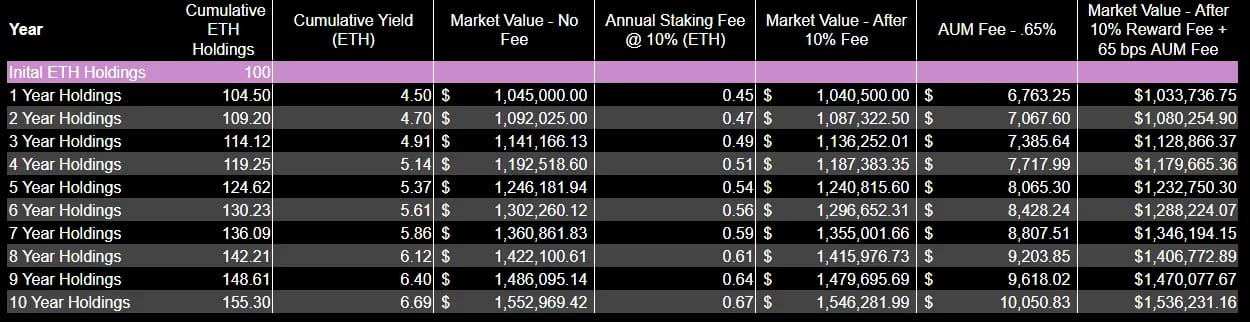
The above data assumes the following:
At the end of year 10, a portfolio of ETH 100% staked would hold 149.78 ETH (after fees). The market value after fees would be $1.49 million.
For reference, the same portfolio of ETH would be worth $1 million at year 10 if no assets were staked.
Furthermore, if the price of ETH were to not appreciate at all, the user staking would still earn $150k in yield - after staking and TER fees.
User Experience: Regulated vs Non-Regulated Staking Products
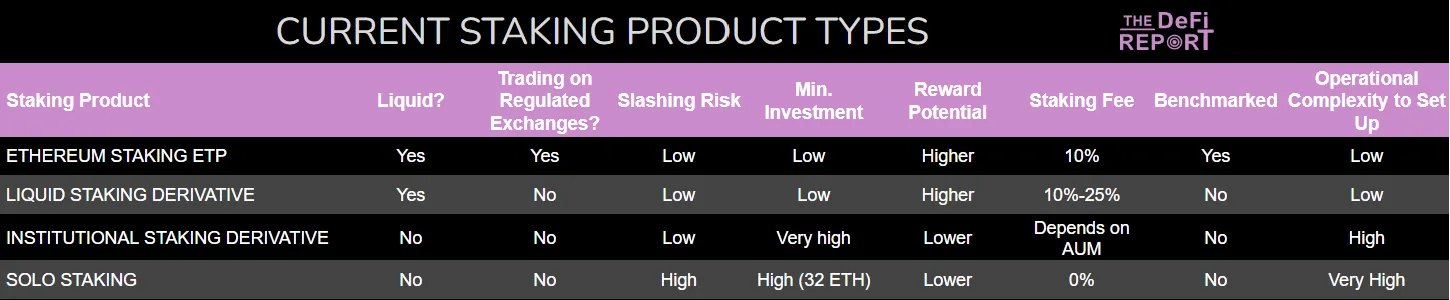
DeFi is largely unregulated today - presenting risks that users of regulated products can avoid. Below is a breakdown of some of the differences amongst product types - and the potential benefits of using a regulated product. Please note the ET32 product is available to professional European investors only today.
Finally, some additional details on the ET32 Total Return Staking ETP offered by ETC Group.
Please note that the products mentioned are available to investors in Europe but limited to professional investors in the United Kingdom. To find out if one or more products are suitable to your investor profile and available in your jurisdiction, please consult with an investment professional.
Wall Street appears to love Bitcoin. But we think a spot ETH ETF could ultimately be even more attractive to institutional investors.
Because Wall Street likes yield. Institutional investors tend to prefer yield that can be paired with leverage + products that are easily explainable to their clients and managers.
Given the demand in the market, and the incentives from issuers to earn fees by selling popular financial products to clients, it seems inevitable that an ETH ETF (and potentially more complex structured products) will be approved in the US.
The economic opportunity is just too big.
Shout out to Europe and ETC Group for showing us the way.
Important information:
This article does not constitute investment advice, nor does it constitute an offer or solicitation to buy financial products. This article is for general informational purposes only, and there is no explicit or implicit assurance or guarantee regarding the fairness, accuracy, completeness, or correctness of this article or the opinions contained therein. It is advised not to rely on the fairness, accuracy, completeness, or correctness of this article or the opinions contained therein. Please note that this article is neither investment advice nor an offer or solicitation to acquire financial products or cryptocurrencies.
Before investing in crypto ETPs, potentional investors should consider the following:
Potential investors should seek independent advice and consider relevant information contained in the base prospectus and the final terms for the ETPs, especially the risk factors mentioned therein. The invested capital is at risk, and losses up to the amount invested are possible. The product is subject to inherent counterparty risk with respect to the issuer of the ETPs and may incur losses up to a total loss if the issuer fails to fulfill its contractual obligations. The legal structure of ETPs is equivalent to that of a debt security. ETPs are treated like other securities.
ETC Group has been created to provide investors with the tools to access the investment opportunities of the digital assets' and blockchain ecosystem. The company develops innovative digital asset-backed securities including ETC Group Physical Bitcoin (BTCE) and ETC Group Physical Ethereum (ZETH) which are listed on European exchanges including XETRA, Euronext, SIX, AQUIS UK and Wiener Börse.
With a track record of over three years, ETC Group is made up of an exceptional team of financial services professionals and entrepreneurs with experience spanning both digital assets and regulated markets. With product quality and safety at the core of our product creation approach, the company aims to continuously launch best-in-class institutional-grade exchange traded products.
As a company, ETC Group has previously launched BTCE - the world’s first centrally cleared Bitcoin exchange traded product on Deutsche Börse XETRA, the largest ETF trading venue in Europe, and also listed DA20, the world’s first crypto ETP tracking an MSCI index signalling a move towards investment management products. DA20 provides broad market exposure to investors by tracking an index of 20 cryptocurrencies which cover 85% of the total crypto market capitalisation.