- Solana exhibits impressive growth, ranking first in bridged net flows, but faces potential challenges in maintaining its position as Ethereum's primary competitor due to Aptos's increasing momentum.
- Ethereum maintains its dominance with 45% market share according to our proprietary Comprehensive Network Dominance Index (CNDI), demonstrating resilience and ongoing ecosystem expansion, despite increased competition from Solana and Aptos.
- We think that investors should hold all 3 assets because Ethereum offers established dominance and stability, Solana demonstrates impressive growth and a proven track record, and Aptos shows potential for future innovation and ecosystem expansion.
Let's dive into the real story of network usage and adoption.
Recent market dynamics have sparked intense debate about Ethereum's competitive position relative to emerging Layer 1 blockchains. With Solana's persistent challenge as the purported 'ETH killer' and Aptos's impressive performance in Q3 2024, bearish sentiment regarding Ethereum's market position has gained traction. Concurrently, speculation has emerged about Aptos becoming a potential 'Solana killer.' These market narratives warrant a thorough investigation of on-chain metrics to separate signal from noise.
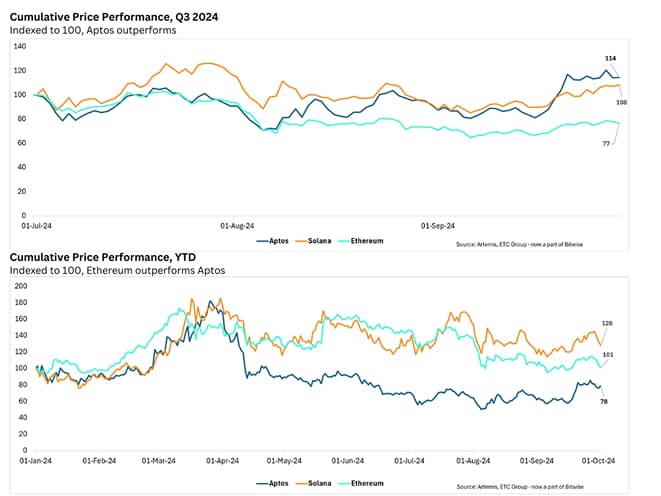
Examining the cumulative price performance (indexed at 100) for Q3 2024, we observe a telling picture. Ethereum's performance index stands at 77, indicating underperformance relative to its peers. In contrast, Solana and Aptos demonstrate positive momentum with performance indices of 108 and 114, respectively. This short-term view has fueled speculation about a potential shift in the competitive landscape of Layer 1 protocols.

However, broadening our perspective to year-to-date (YTD) performance reveals a different narrative. Ethereum maintains a solid position with a performance index of 101, firmly situated between Solana's standout 128 and Aptos' 78. This wider view serves as a crucial calibration for investors who might be swayed by short-term market movements.
Ethereum's recent underperformance can be attributed to several factors. While current sentiment leans towards migration to layer 2s as being the main culprit, there are other factors that play a part such as the Dencun upgrade in March 2024, which led to a decline in total transaction fees and network activity. Additionally, exogenous factors such as the unwinding of the Japanese Yen (JPY) carry trade in early August 2024 triggered deleveraging across multiple asset classes, with ETH particularly affected. Furthermore, disappointing ETF flows have contributed to the recent price weakness.

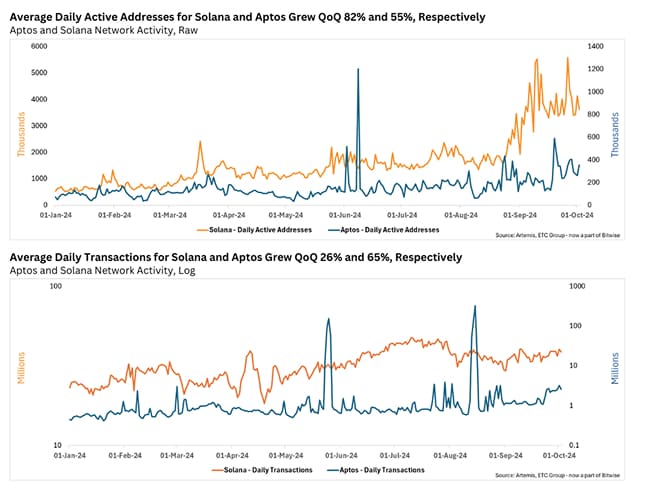
Meanwhile, Solana and Aptos have shown impressive network growth, with daily active addresses and transactions increasing significantly QoQ. Aptos' performance spikes, driven by the Tapos Cat Game, highlight its strong potential in the GameFi sector and its ability to handle high transaction volumes at lower costs.
There is a sentiment that Move-based chains like Aptos face developer adoption challenges as developers are slow to shift to new languages without clear benefits. Mature tooling and infrastructure for existing languages like Rust, used by Solana, give it an advantage. However, Aptos' developer activity is 23% higher than the average of other Layer 1s, indicating promising sentiment.
Solana has also outperformed the market in other metrics. In Q3 2024, it ranked first in top bridged net flows with $1 billion in net inflows, ~70% more than the second-ranked Ethereum Layer 2, OP Mainnet.
Network Dominance Analysis
To assess network dominance across Ethereum (including its top five Layer 2 solutions), Solana, and Aptos, we employ five key metrics: Network Utilization Efficiency (NUE), Economic Density Index (EDI), Network Activity Score (NAS), Adoption-Adjusted Usage (AAU), and Logarithmic Network Dominance (LND). These metrics are combined into a Comprehensive Network Dominance Index (CNDI) to provide a holistic view of each network's relative strength.
- Network Utilization Efficiency (NUE)

The Network Utilization Efficiency (NUE) metric measures how effectively a blockchain network converts its economic value into transactional activity. Ethereum demonstrated stable and efficient network value utilization, maintaining consistent performance in the normalized data. Solana's relative performance decreased sharply over time when normalized, while Aptos's efficiency gains were less substantial than initially apparent, with peaks in raw NUE considerably muted in the normalized view.
- Economic Density Index (EDI)

The Economic Density Index (EDI) evaluates the economic intensity of network usage. Ethereum maintained its leadership position in economic density, underscoring its robust ecosystem and high-value transactions. Solana's relative performance declined, while Aptos exhibited a notable improvement, overtaking Solana since September.
- Network Activity Score (NAS)

The Network Activity Score (NAS) offers a balanced view of overall network activity. This metric uniquely positioned Solana as the frontrunner, suggesting its strength in balancing user activity, transaction volume, and economic transfers more effectively than its competitors.
- Adoption-Adjusted Usage (AAU)

The Adoption-Adjusted Usage (AAU) metric indicates how much of a network's potential is being realized. Ethereum showed overall dominance in raw AAU data, while Solana's normalized AAU revealed a declining trend entering Q4, suggesting a divergence between its market valuation and actual network utilization. Aptos' spikes appeared less pronounced in the normalized representation.
- Logarithmic Network Dominance (LND)

The Logarithmic Network Dominance (LND) offers a composite view of network dominance across multiple factors. In raw terms, Ethereum emerged as the clear leader, reflecting its comprehensive strength. The normalized LND suggested a narrowing competitive gap, with Ethereum maintaining a lead, followed by Solana and Aptos.
- Comprehensive Network Dominance Index (CNDI)

Where w is our assigned weighting of 20% (equal weighting).
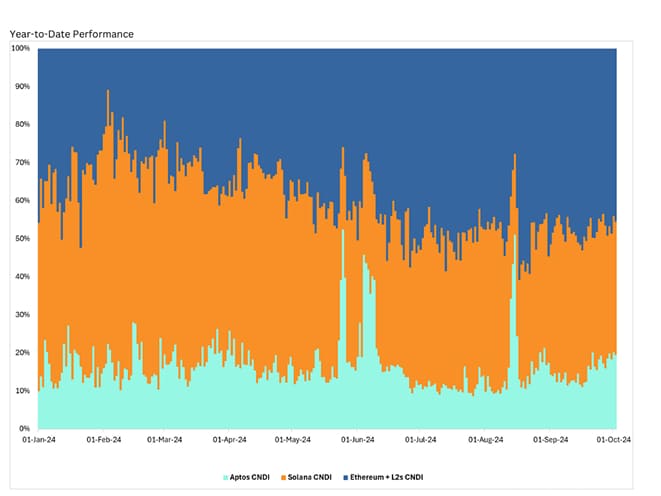
The Comprehensive Network Dominance Index (CNDI) provides a holistic view of the competitive landscape among Ethereum, Solana, and Aptos by synthesizing the five previously discussed metrics. As of the latest data, Ethereum maintains a leading position with 45% dominance, followed by Solana at 35%, and Aptos at 20%. Ethereum's dominance shows a steady uptrend, reinforcing its position as the pre-eminent blockchain platform. This consistent growth suggests ongoing ecosystem expansion and sustained user engagement, despite facing increased competition. Ethereum's resilience in maintaining its market share underscores the strength of its established network effects and diverse application ecosystem.
Conversely, Solana exhibits a downward trend in its dominance. While still commanding a significant portion of the market, this decline may indicate growing competitive pressures from other networks, particularly Aptos. As Aptos gains momentum and captures a larger share of the market, Solana may face challenges in maintaining its position as the primary competitor to Ethereum.

Bottom Line
- Solana exhibits impressive growth, ranking first in bridged net flows, but faces potential challenges in maintaining its position as Ethereum's primary competitor due to Aptos's increasing momentum.
- Ethereum maintains its dominance with 45% market share according to our proprietary Comprehensive Network Dominance Index (CNDI), demonstrating resilience and ongoing ecosystem expansion, despite increased competition from Solana and Aptos.
- We think that investors should hold all 3 assets because Ethereum offers established dominance and stability, Solana demonstrates impressive growth and a proven track record, and Aptos shows potential for future innovation and ecosystem expansion.
Important information:
This article does not constitute investment advice, nor does it constitute an offer or solicitation to buy financial products. This article is for general informational purposes only, and there is no explicit or implicit assurance or guarantee regarding the fairness, accuracy, completeness, or correctness of this article or the opinions contained therein. It is advised not to rely on the fairness, accuracy, completeness, or correctness of this article or the opinions contained therein. Please note that this article is neither investment advice nor an offer or solicitation to acquire financial products or cryptocurrencies.
Before investing in crypto ETPs, potentional investors should consider the following:
Potential investors should seek independent advice and consider relevant information contained in the base prospectus and the final terms for the ETPs, especially the risk factors mentioned therein. The invested capital is at risk, and losses up to the amount invested are possible. The product is subject to inherent counterparty risk with respect to the issuer of the ETPs and may incur losses up to a total loss if the issuer fails to fulfill its contractual obligations. The legal structure of ETPs is equivalent to that of a debt security. ETPs are treated like other securities.
