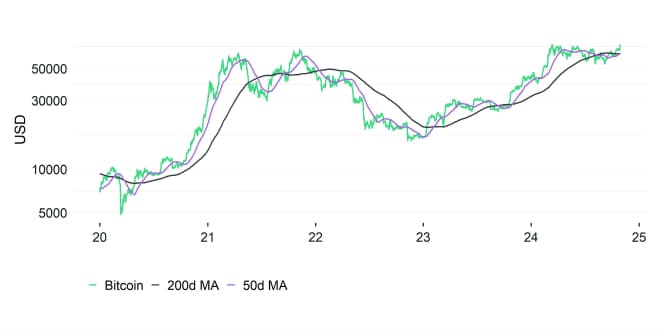
- Performance: October started slow for crypto markets due to geopolitical tensions, but a sharp recovery followed, fuelled by significant US Bitcoin ETF inflows and historical seasonal strength. Bitcoin outperformed altcoins, reaching a dominance level of 60%, as Ethereum saw lower inflows compared to Bitcoin, despite strong network activity in Ethereum Layer 2s like Base. With November historically being the best month for Bitcoin, and potential US election impacts looming, Bitcoin and cryptoassets are poised for strong performance in the coming months.
- Macro: In October, market focus shifted from Fed policy to global reflation efforts, especially as China implemented measures to boost its economy, countering the Fed's rate cuts. Rising US Treasury yields and a stronger dollar created headwinds for Bitcoin, with elevated US debt and fiscal sustainability concerns prompting investors to turn to hard assets like Bitcoin and gold as potential reserve assets. Despite potential recession indicators, Bitcoin’s scarcity and institutional interest are projected to support its role as a hedge, especially if dollar appreciation and yield increases subside due to economic strain.
- On-Chain: October saw rising Bitcoin demand driven by increasing whale activity, record-breaking spot ETF inflows, and growing OTC desk balances, indicating institutional interest. However, significant selling due to short-term profit-taking, and muted retail engagement have so far hindered Bitcoin from reaching new all-time highs despite a tightening Bitcoin supply. As the supply scarcity intensifies, reduced selling pressure could potentially propel Bitcoin prices upward in the future.
Chart of the Month
Performance
The performance October was initially off to a rough start. Expectations of a very positive performance at the beginning of the month were negatively affected by the rise in geopolitical tensions in the Middle East.
However, as we have outlined in one of our Crypto Market Espresso reports, sell-offs in Bitcoin and cryptoassets due to a rise geopolitical tensions usually tend to be tactical buying opportunities. In this case, the market did in fact recover sharply and approached new all-time highs as well.
As far as performance seasonality is concerned, October tends to be one of the best performance months for Bitcoin historically which is why it is often dubbed “Uptober”.
One of the major catalysts for the positive reversal in October was a strong acceleration in US spot Bitcoin ETF inflows as well as general on-chain capital inflows that supported overall crypto market developments.
This happened despite a very significant increase in US Treasury yields and the US Dollar in October that somewhat counteracted previous monetary policy easing measures by the Fed.
The recent Chinese economic reflation seems to be one of the key drivers but there are also increasing sovereign risks in bond markets worldwide.
For instance, there is increasing pressure on the US fiscal situation as interest expenses are accelerating sharply. Since September alone, the US federal debt has increased by almost half a trillion dollars which has fuelled concerns about the sustainability of US fiscal deficits.
UK gilts have recently sold off sharply as well as the UK government's latest budget release also appears to jeopardise the sustainability of UK public debt. France's 10-year sovereign swap spreads have also reached the highest level since the European sovereign debt crisis in 2012 signalling elevated sovereign risks on the European continent that is still mired in recession.
Meanwhile, BRICS countries like China continue to diversify away from US Treasuries.
It is no surprise that in this kind of environment hard assets like gold and bitcoin have been one of the best performing assets in October.
What is more is that November has historically been the best performance month for Bitcoin on average which is why the positive trend in October should most likely repeat itself this month.
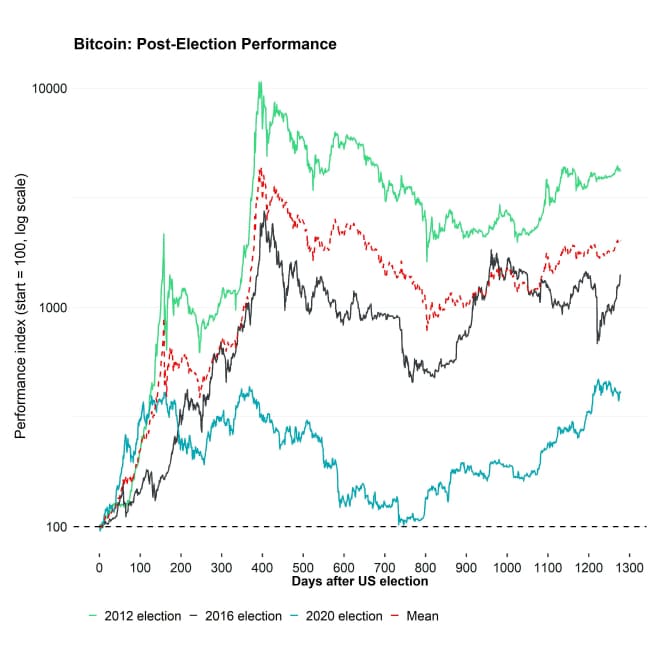
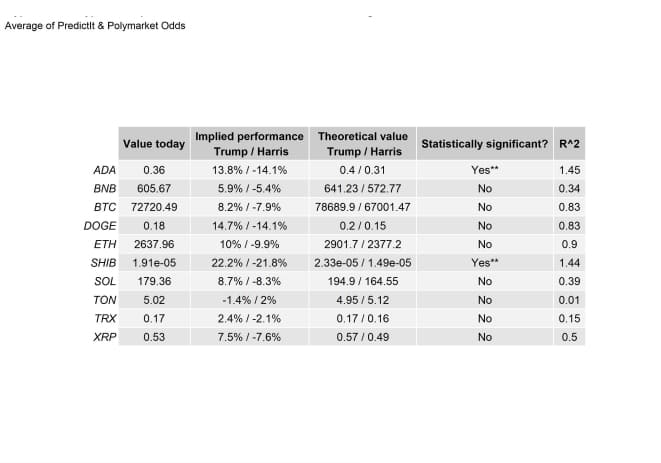
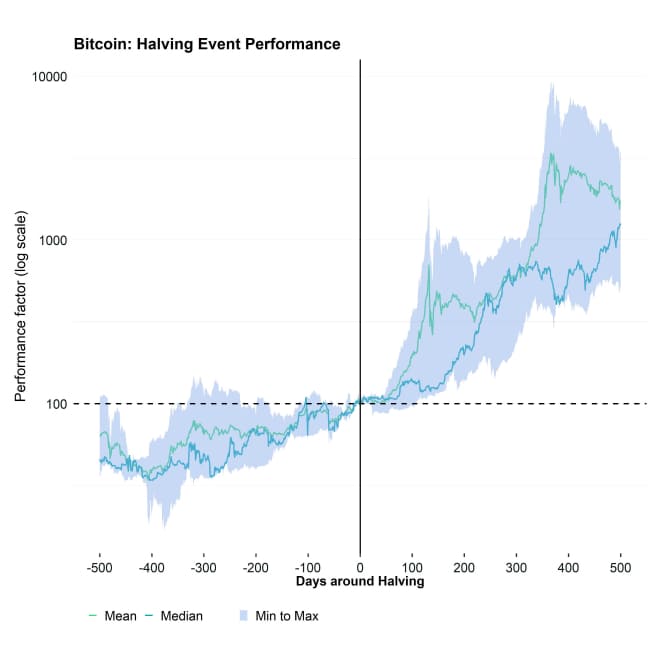
In this context, we also expect that the US election could become an important catalyst for the market and, regardless of the final election outcome, Bitcoin and other cryptoassets are poised to perform very positive over the coming months as shown in our Chart-of-the-Month above.
We have analysed the impact of the US election on cryptoasset markets from a pure quantitative perspective in more detail here.
Although there are certain nuances between both Harris and Trump, we only expect the US election to have short-term impact on performance in November before other factors such as macro and on-chain developments will become more important again.
That being said, if the elections were already held today, a Trump / Harris victory would imply a positive / negative performance of around +8.2% / -7.9% for Bitcoin, respectively, based on bitcoin's historical sensitivity to these election betting odds.
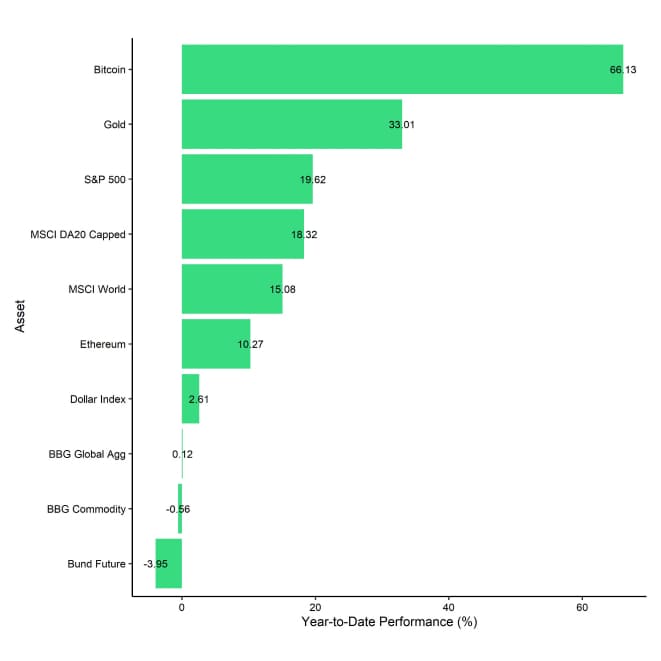
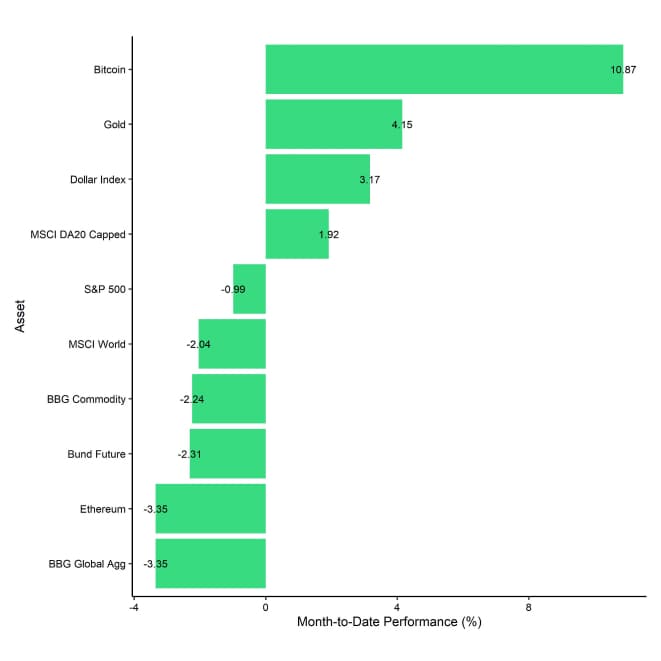
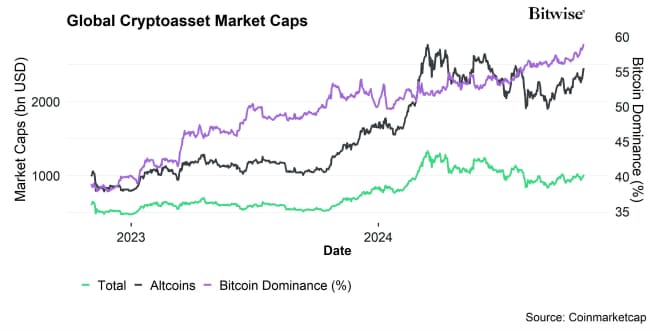
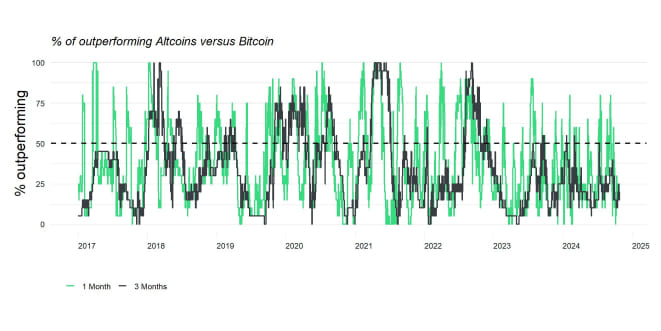
In this environment, altcoins generally underperformed Bitcoin in October. Bitcoin's market cap dominance also reached 60% in October – the highest level since April 2021.
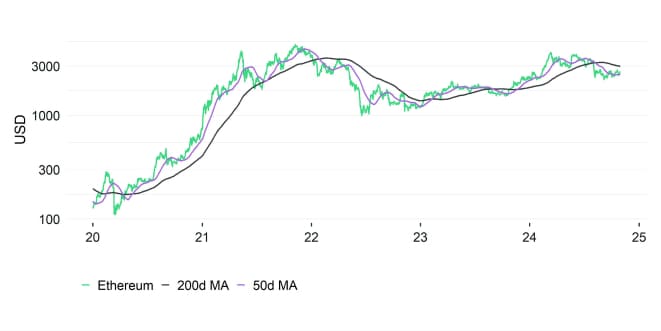
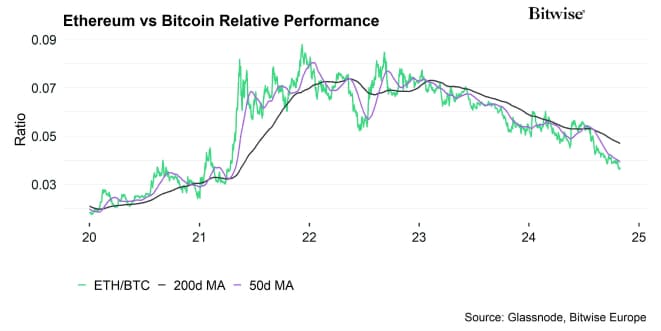
At this point, a general reversal in altcoin underperformance seems to be highly dependent on a reversal in the relative performance between Ethereum and Bitcoin. Ethereum has underperformed Bitcoin during October significantly on account of several potential reasons. ETF inflows into US spot Ethereum ETFs continued to underwhelm relative to US spot Bitcoin ETFs. The same is true for general on-chain capital inflows into Ethereum.
In this context, it important to highlight that it is less a weakness in Ethereum flows but rather a relative strength in Bitcoin flows.
Meanwhile, network activity on Ethereum's Layer 2s such as Base continues to be very strong due ongoing increase in stablecoin volumes. In fact, Base has achieved the highest daily stablecoin transfer volume, surpassing Ethereum L1, Solana, and Tron for the first time. So, the recent underperformance seems to be less related to network activity but rather relative capital flows based on these observations.
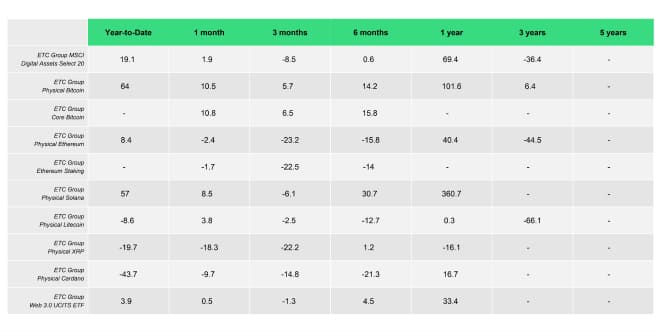
A closer look at our product performances also reveals that Bitcoin ETPs such as the ETC Group Physical Bitcoin (BTCE) and ETC Group Core Bitcoin (BTC1) have been one of best performing products in October and also year-to-date:
Bottom Line: October started slow for crypto markets due to geopolitical tensions, but a sharp recovery followed, fuelled by significant US Bitcoin ETF inflows and historical seasonal strength. Bitcoin outperformed altcoins, reaching a dominance level of 60%, as Ethereum saw lower inflows compared to Bitcoin, despite strong network activity in Ethereum Layer 2s like Base. With November historically being the best month for Bitcoin, and potential US election impacts looming, Bitcoin and cryptoassets are poised for strong performance in the coming months.
Macro Environment
While the macro narrative in September was all about the Fed pivot, market attention in October shifted to a focus on reflation amid the concerted efforts by the PBoC and the Chinese government to revive the Chinese economy.
This has mostly counteracted the efforts by the Fed to guide interest rates lower.
In fact, US 10-year yields have already risen by more than +50 bps in October largely driven by an increase in term premia but also a revival in inflation expectations. Meanwhile, Fed Funds Futures have started to price out a more aggressive rate cutting cycle due to this reacceleration in growth and inflation expectations.
More specifically, at the time of writing, Fed Funds Futures only price in additional -125 bps in rate cuts until the end of 2025 which is down from almost -200 bps in rate cuts priced in at the beginning of October.
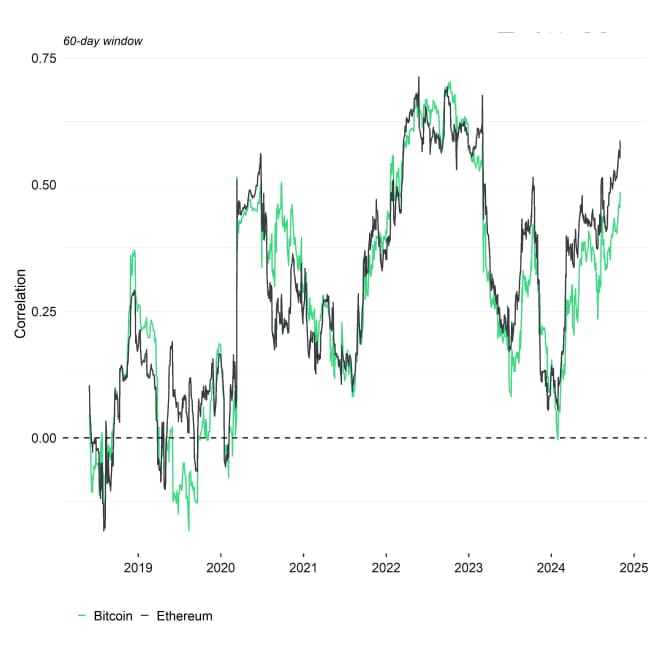
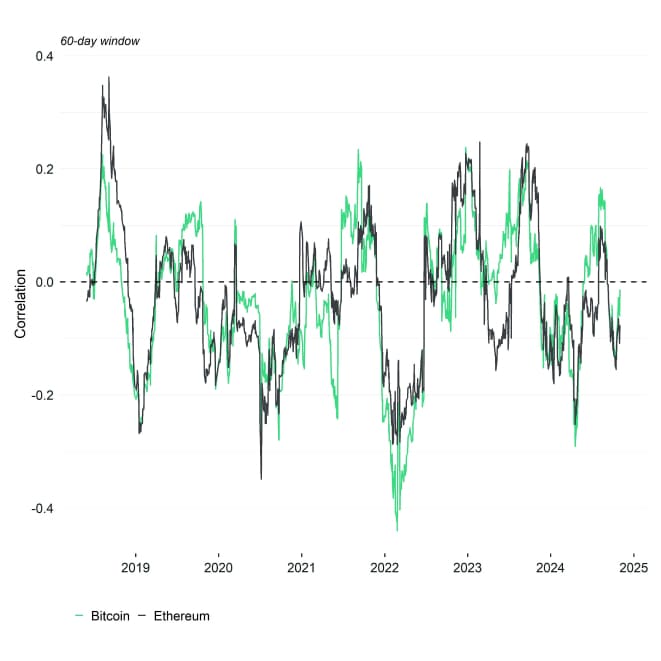
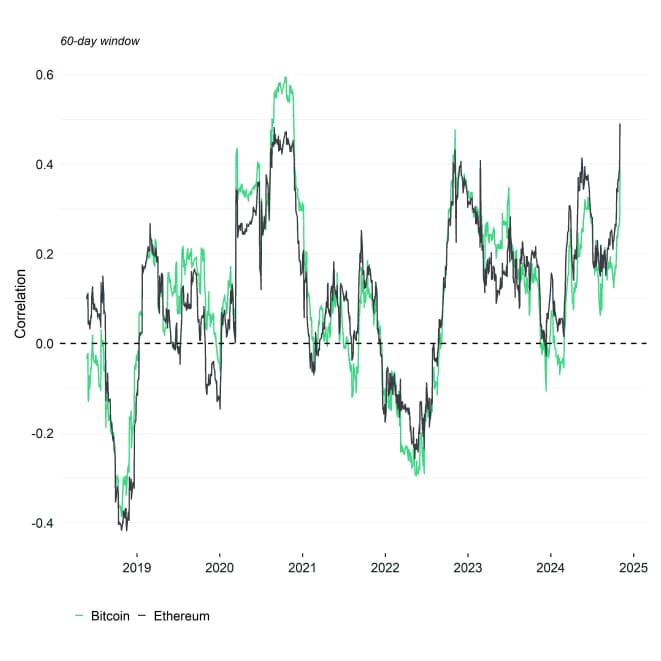
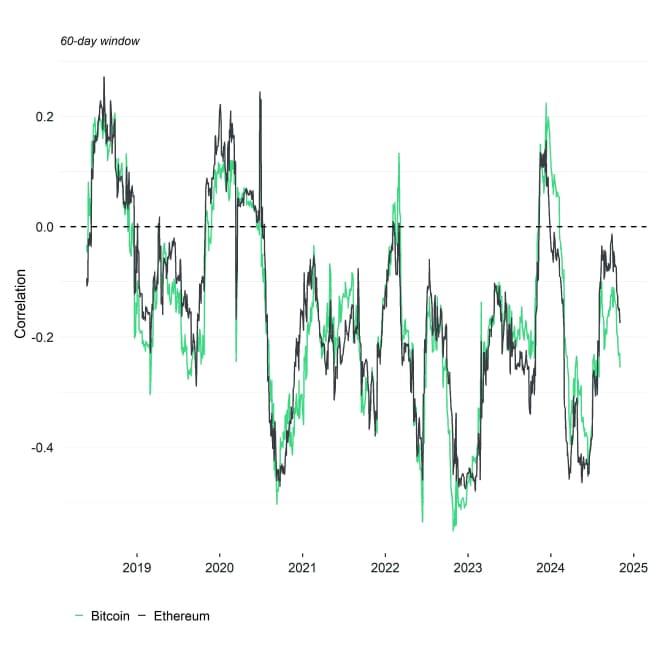
The rise in US Treasury yields has likely affected Bitcoin negatively in the short term since the rise in yields was also associated with an appreciation of the US dollar which tends to be negative for Bitcoin based on our quantitative analyses.
Besides, there has been an increase in bond market uncertainty due to a significant increase US public debt over the past couple of weeks. Since the beginning of September alone, US total public debt has increased by almost half a trillion dollars alone. As a result, the MOVE Index which is a measure of option-based bond market volatility has increased to the highest level since December 2023.
This rather appears to be related to an increase in genuine selling pressure in US Treasuries rather than an increase in US Treasury illiquidity based on the US government securities liquidity index provided by Bloomberg (GVLQUSD Index). Liquidity in US Treasuries has continuously improved since August based on this metric.
In fact, prominent investors like Stanley Druckenmiller or Paul Tudor Jones have publicly stated to either avoid or being outright short US Treasuries (and long hard assets like gold or bitcoin).
A major concern among investors appears to be the decreasing fiscal sustainability of US public debt. Annual interest expenses on federal debt have just recently surpassed 1 trn USD p.a. and fiscal deficits are the highest they have ever been outside of a US recession. As of Q3 2024, the US budget balance is at -6.3% of GDP.
In this context, hard assets like Bitcoin can play a valuable role in a broader portfolio. Foss (2021) has already shown that Bitcoin as counterparty risk-free and censorship-resistant asset can act as a hedge against sovereign default.
In his model, Foss makes use of the fact that sovereign Credit Default Swaps (CDS) implicitly price the probability of default and based on this inherent probability and the market value of sovereign bonds “at risk” you can derive a theoretical market value for Bitcoin as an insurance asset against a default of these sovereign bonds.
Based on this model, if Bitcoin would insure against the default of G20 sovereign bonds, the theoretical market value of Bitcoin would already be around 216k USD based on a weighted default probability of 6.15% for the basket of G20 sovereigns.
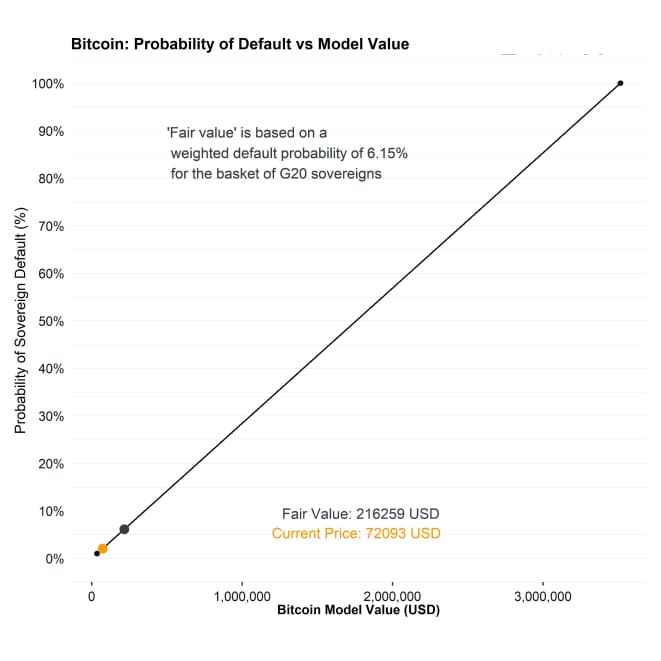
Within this model, if either the weighted default probability increases and/or the market value of sovereign bonds increases, Bitcoin's theoretical market value also increases.
It is also important to highlight, that there has been a significant diversification among foreign investors away from US Treasuries into alternative stores-of-value like gold. As a result, gold's share in international reserves has leapfrogged the Euro and is only second to the US Dollar again. There is an increasing shift due to rising geopolitical risks and the above-mentioned concerns about the US fiscal situation.
On this note, we would like to reiterate our stance that Bitcoin is a serious contender to be an alternative reserve asset next to US Treasuries and gold as explained in more detail here. The reason is that increasing scarcity and adoption of Bitcoin will likely outpace those of its traditional counterparts, leading to an increasing market share over time. For instance, after the latest Bitcoin Halving in April this year, Bitcoin is already double as scarce as gold from a pure production point-of-view.
This scenario is becoming increasingly likely with rising odds of a Trump victory in the upcoming presidential election since he has promised to establish Bitcoin as strategic reserve asset. At the time of writing, Trump's odds of winning the presidency are now at around 60.5% vs 39.0% for Harris based on the average betting odds across multiple sites. In this context, we would like to highlight our Crypto Market Espresso report on the potential impact of the US election on major cryptoassets.
If the elections were already held today, a Trump / Harris victory would imply a positive / negative performance of around +8.2% / -7.9% for Bitcoin, respectively, based on bitcoin's historical sensitivity to these election betting odds.
If Trump became president, this would increase the odds of such a scenario.
Hypothetically speaking, if Bitcoin disrupted gold as the main reserve asset and reached the same market cap like gold right now, a single bitcoin would cost approximately 921k USD.
Moreover, if Bitcoin disrupted US Treasuries as the main reserve asset, a single Bitcoin would cost approximately 1.4 mn USD.

Concerning US recession, the jury is still out there. Latest non-farm payrolls for September have been surprisingly robust and the unemployment rate even decreased slightly despite the fallout from the Hurricane in some US states.
That being said, there are still significant discrepancies between nation-wide unemployment data and aggregated state-level data. Moreover, September jobs numbers were significantly propped up by an “abnormal spike” in government payrolls which seems to be unsustainable.
Based on a nowcast of GDP growth like GDPNow by the Atlanta Fed, the US economy does not appear to be in a recession right now. However, the ongoing weakness in US housing still increases the vulnerability to shocks that could push the economy into recession.
Just to name a few highlights:
- The recent Fed pivot has so far failed to reignite the mortgage market: The MBA purchase index is still hovering near cycle lows.
- Existing home sales have also dropped to a new cycle low in September
- Construction payrolls are at risk of contracting sharply due to the subset decline in homes under construction.
- In general, US residential investment is the only sub-component of GDP which is negative which tends to foretell recessions historically.
- An all-time record of 87% of surveyed Americans say that it's now a “bad” time to buy a home, more than double the 2008 peak, according to the latest University of Michigan consumer survey.
Ongoing weakness in US housing could therefore lead to significant declines in construction employment which tends to be a leading sector for overall employment trends.
What is more US that the Conference Board's own Leading Economic Index (LEI) continues to contract and signal an imminent recession.
That being said, we reiterate our stance from last month's report that a US recession and renewed slowdown in global growth expectations most-likely won't affect bitcoin and other cryptoassets negatively.
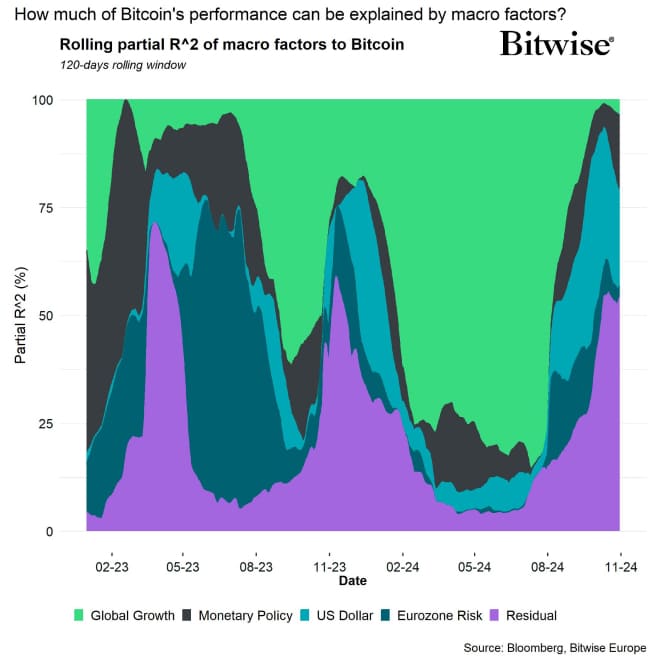
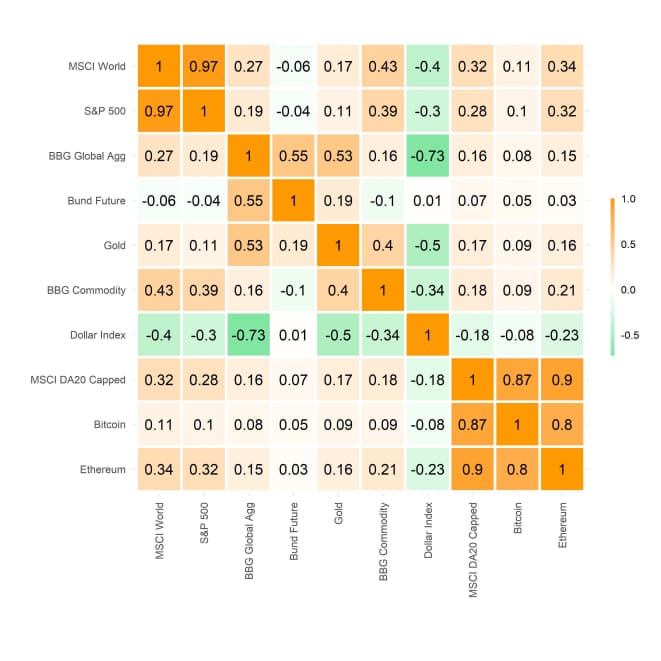
More specifically, our own macro factor model for Bitcoin implies that, over the past 120 trading days, the US Dollar as well as coin-specific factors like the Halving have become the most important factors for the performance of Bitcoin.
This means that the recent appreciation of the US Dollar has been a headwind to bitcoin's performance more recently.
That being said, there is some reflexivity in the most recent macro developments. Higher yields and a stronger Dollar will curtail economic growth in the US via a deteriorating housing market. This will eventually lead to loosening monetary policy and a weakening Dollar again.
So, there is a certain limit to how much yields and the Dollar can rise further before inducing too much economic pain.
This implies that both appreciation of the US Dollar and rising yields will probably reverse sooner than later.
Bottom Line: In October, market focus shifted from Fed policy to global reflation efforts, especially as China implemented measures to boost its economy, countering the Fed's rate cuts. Rising US Treasury yields and a stronger dollar created headwinds for Bitcoin, with elevated US debt and fiscal sustainability concerns prompting investors to turn to hard assets like Bitcoin and gold as potential reserve assets. Despite potential recession indicators, Bitcoin's scarcity and institutional interest are projected to support its role as a hedge, especially if dollar appreciation and yield increases subside due to economic strain.
On-Chain Developments
On-chain developments in October are signalling a significant increase in demand for bitcoin.
For instance, BTC whale holdings' 1-year growth rate has increased to the highest level ever. Besides, the absolute number of whales just reached the highest level since January 2021 in October:
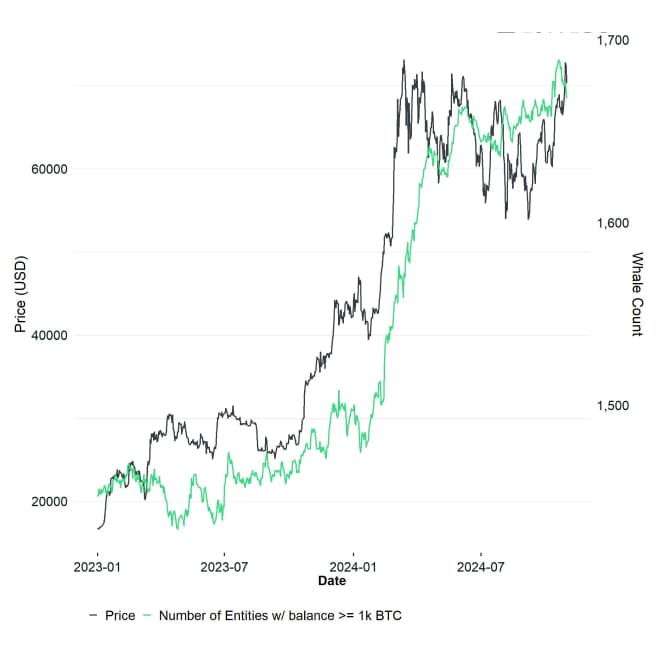
In this context, whales are defined as network entities that control at least 1000 BTC.
This is also consistent with the fact that the amount of capital invested by whales who have entered over the past 155 days has reached a new all-time high and is accelerating, according to data provided by Cryptoquant.
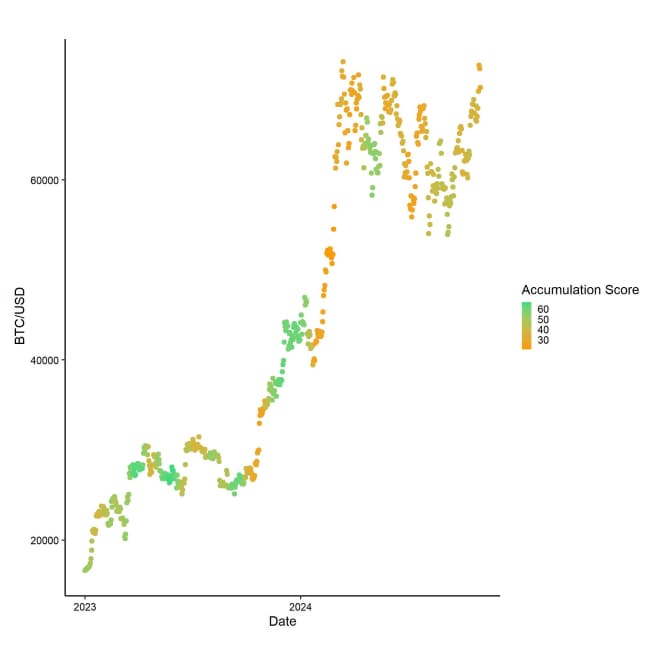
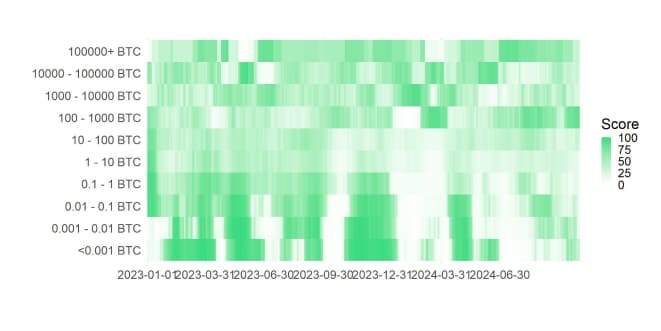
Indeed, the latest increase in accumulation activity seems to be confined to larger investor groups while retail participation remains relatively muted.
For instance, Google search interest for “bitcoin” remains near cycle lows and smaller on-chain wallet transactions also imply low retail activity.
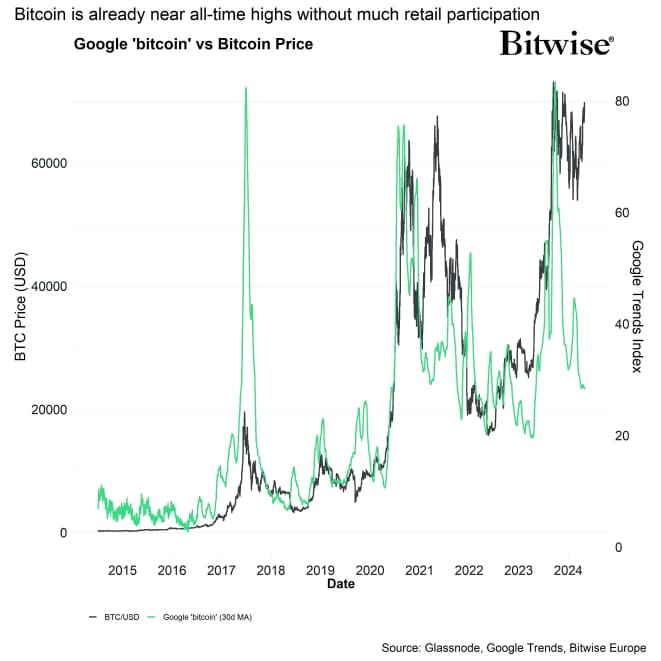
The relative share of transfer volumes by smaller wallet cohorts up until 10k USD holdings is still only at around 3%-6% according to data provided by Glassnode. Although there has been a pick-up in transfer volumes among these cohorts, the market remains heavily dominated by larger investors.
On the bright side, low retail participation also implies that we still have significant “dry powder” in terms of additional capital flows once we breach new all-time highs, which is usually the moment retail investors start to pay more attention to Bitcoin and cryptoassets in general.
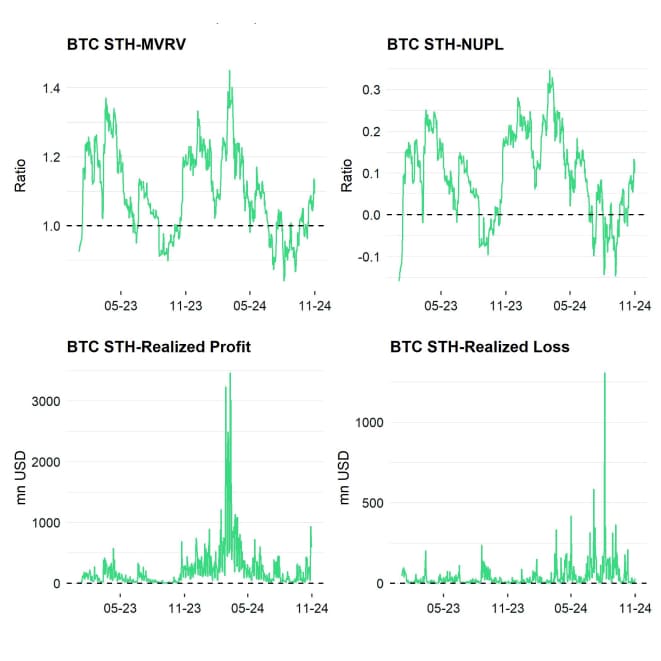
Nonetheless, short-term holder activity has already been increasing late September judging by the “Supply Delta” metric. It measures the relative trends in short-term holder supply relative to long-term holder supply.
Increasing OTC desk balances/inventories also point towards increasing demand. This may be directly linked to the acceleration in net inflows into US spot Bitcoin ETFs more recently.
More specifically, weekly flows into US spot Bitcoin ETFs have increased to the highest level since April 2024. Over the past 3 weeks alone, US spot Bitcoin ETFs have experienced almost +5 bn USD in net inflows.
Wednesday this week saw the highest daily net inflows into US spot Bitcoin ETFs since March 2024 with around +893 mn USD in net inflows.
BlackRock's IBIT even saw the highest daily net inflow on record. These US spot Bitcoin ETF inflows are equivalent to purchases of approximately 12,422 BTC on a single day which is significantly higher than the daily mined supply of around 450 BTC.

The increasing demand via ETFs is certainly playing into the increasing supply scarcity of Bitcoin.
Overall, apparent demand measured by the change in supply minus the change in inventories (supply inactive for +1 years) has been rising rapidly as well – it recently highest level since April 2024.
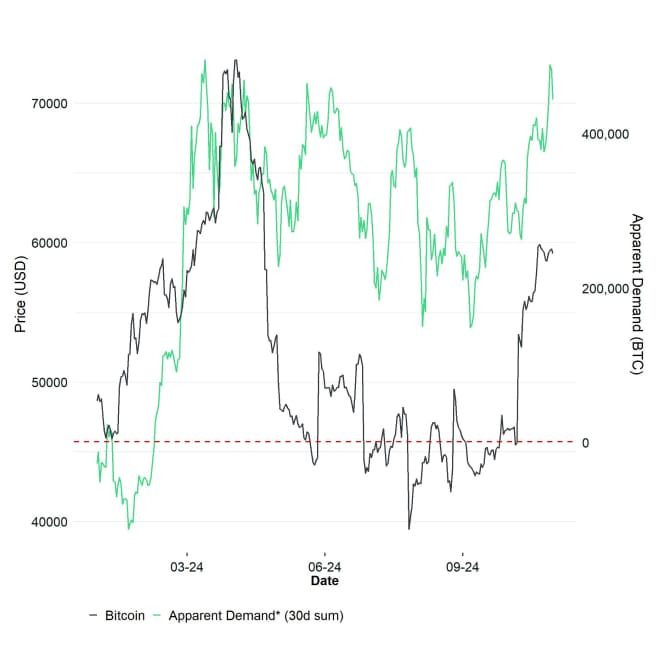
However, the price has so far failed to reclaim new all-time highs which has puzzled many investors.
There are several potential reasons for this:
Firstly, whales have sent bitcoins to exchanges on a net basis over the past 7 days. More specifically, they have sent around 10,065 BTC to exchanges which is a signal for increasing selling pressure exerted by whales.
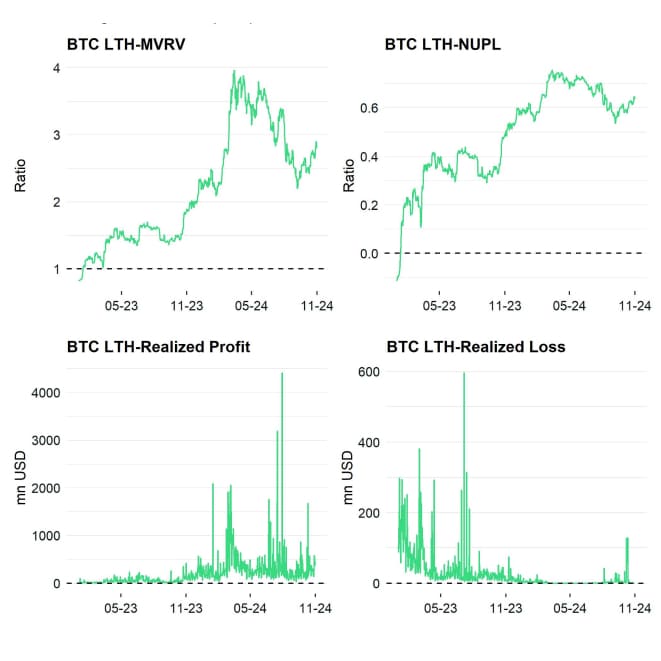
Secondly, we have seen a significant spike in short-term holder realized profits, i.e. profit-taking into this rally.
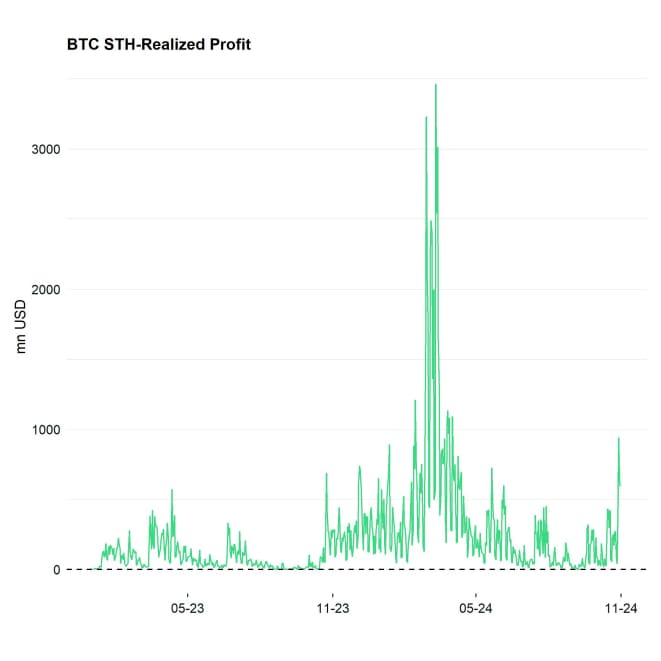
Note: Short-term holder activity is also mostly dominated by whales, not by retail.
It is also worth mentioning that on-chain flows still remain approximately 5x as large as the recent ETF flows.
Thirdly, despite this increase in spot ETF inflows, net buying volumes on spot exchanges has not really turned positive, implying significant selling pressure in the background.
One of these larger holders is the government of Bhutan who is reportedly one of the biggest sovereign BTC miners in the world. The government has just recently sent around 934 BTC to Binance according to data provided by Arkham. At the time of writing, the Bhutanese government still controls around 12k BTC. Further distributions of BTC by the Bhutanese government remains a downside risk in the short term.
However, looking at general BTC supply dynamics, we are continuing to see that the supply shock emanating from the Halving continues to intensify.
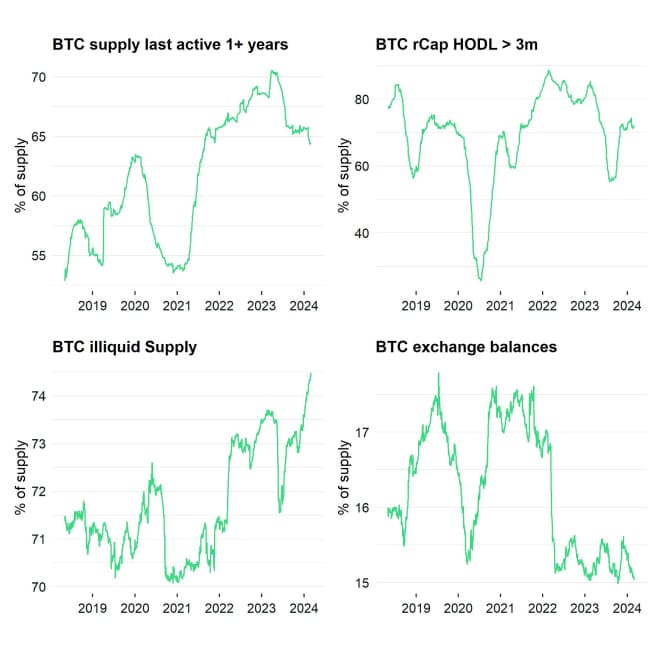
On the one hand, measures of liquid and highly liquid supply have reached year-to-date lows while on the other hand measures of illiquid supply have reached a new all-time according to data provided by Glassnode.
This is also consistent with an ongoing decline in BTC exchange balances, which have reached a new multi-year low as well based on data by CryptoQuant.
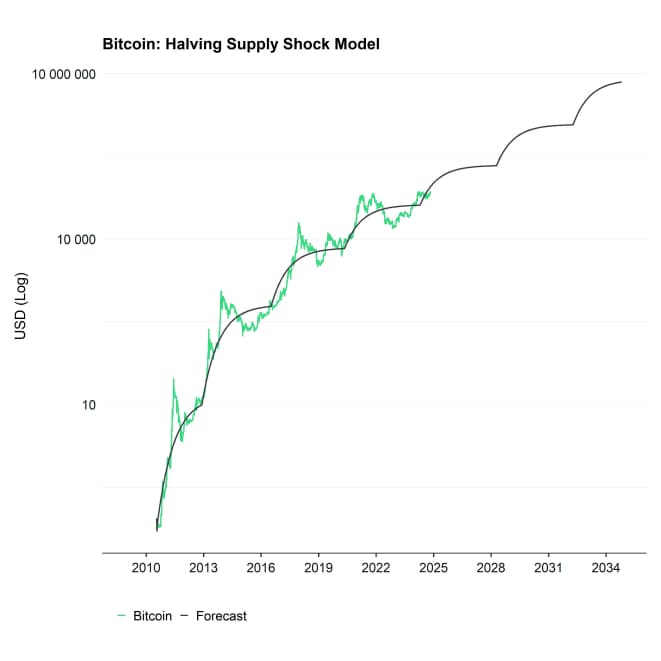
On account of this increasing scarcity, we think that Bitcoin's price is akin to a “coiled spring” where underlying upwards pressure is increasing which is also implied by the Halving supply shock model:
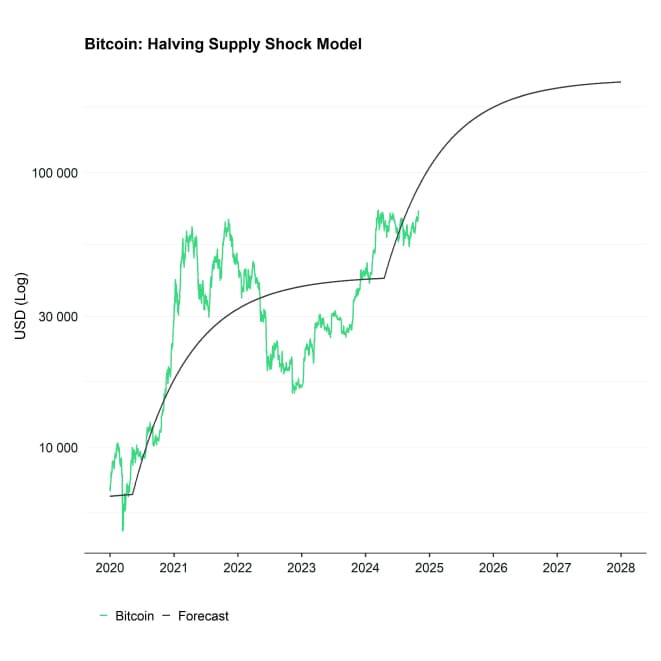
In other words, short-term holder profit-taking has held bitcoin back from regaining new all-time highs but the underlying supply scarcity will continue to build upward pressure on the price. The moment profit-taking decelerates, we expect the price to continue moving higher.
Bottom Line: October saw rising Bitcoin demand driven by increasing whale activity, record-breaking spot ETF inflows, and growing OTC desk balances, indicating institutional interest. However, significant selling due to short-term profit-taking, and muted retail engagement have so far hindered Bitcoin from reaching new all-time highs despite a tightening Bitcoin supply. As the supply scarcity intensifies, reduced selling pressure could potentially propel Bitcoin prices upward in the future.
Bottom Line
- Performance: October started slow for crypto markets due to geopolitical tensions, but a sharp recovery followed, fuelled by significant US Bitcoin ETF inflows and historical seasonal strength. Bitcoin outperformed altcoins, reaching a dominance level of 60%, as Ethereum saw lower inflows compared to Bitcoin, despite strong network activity in Ethereum Layer 2s like Base. With November historically being the best month for Bitcoin, and potential US election impacts looming, Bitcoin and cryptoassets are poised for strong performance in the coming months.
- Macro: In October, market focus shifted from Fed policy to global reflation efforts, especially as China implemented measures to boost its economy, countering the Fed's rate cuts. Rising US Treasury yields and a stronger dollar created headwinds for Bitcoin, with elevated US debt and fiscal sustainability concerns prompting investors to turn to hard assets like Bitcoin and gold as potential reserve assets. Despite potential recession indicators, Bitcoin’s scarcity and institutional interest are projected to support its role as a hedge, especially if dollar appreciation and yield increases subside due to economic strain.
- On-Chain: October saw rising Bitcoin demand driven by increasing whale activity, record-breaking spot ETF inflows, and growing OTC desk balances, indicating institutional interest. However, significant selling due to short-term profit-taking, and muted retail engagement have so far hindered Bitcoin from reaching new all-time highs despite a tightening Bitcoin supply. As the supply scarcity intensifies, reduced selling pressure could potentially propel Bitcoin prices upward in the future.
Appendix
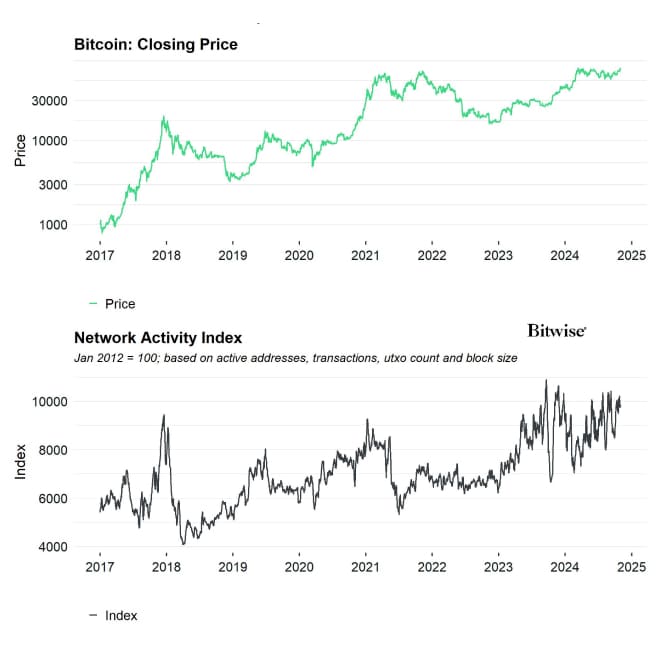
Cryptoasset Market Overview
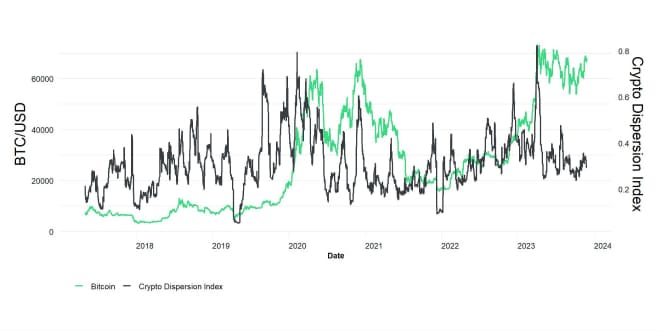
Cryptoassets & Macroeconomy
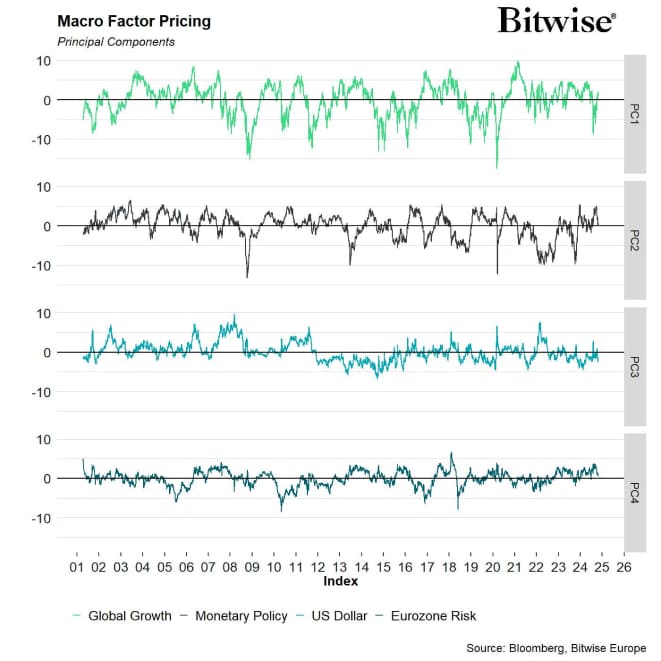
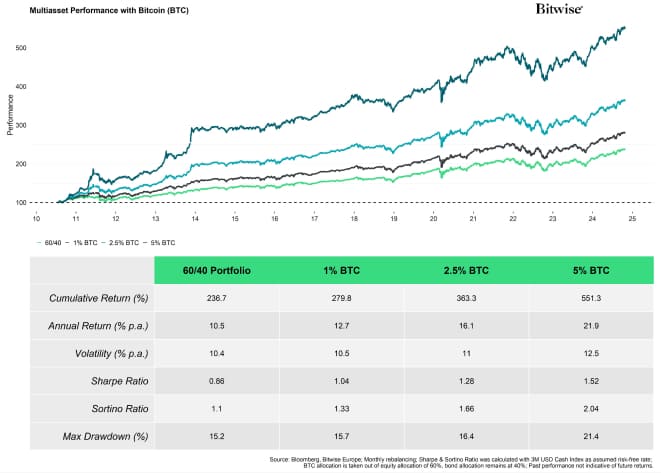
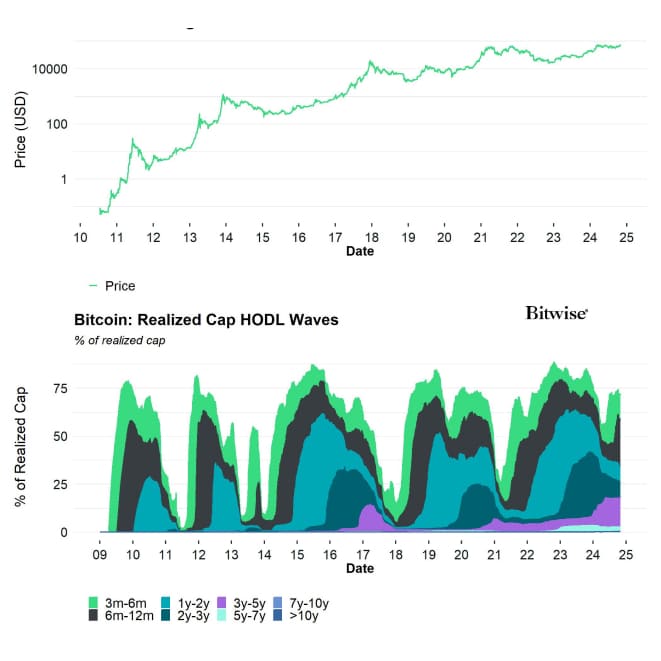
Cryptoassets & Multiasset Portfolios
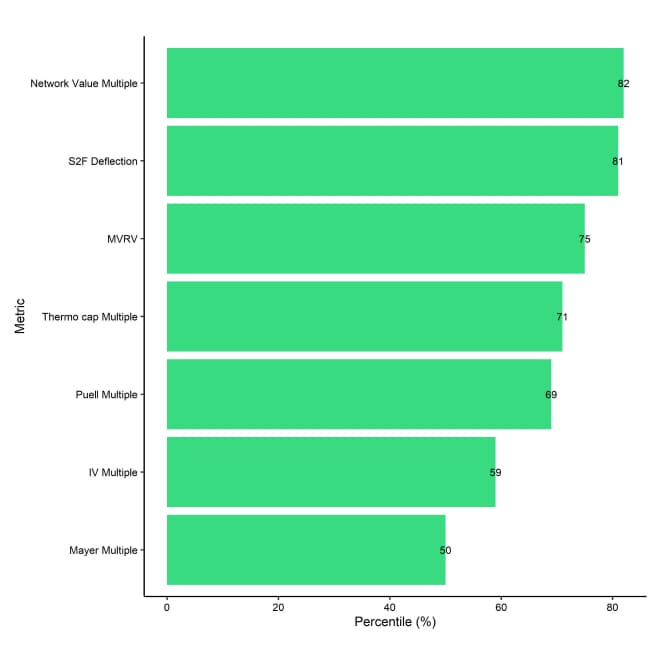
Cryptoasset Valuations
On-Chain Fundamentals
Important information:
This article does not constitute investment advice, nor does it constitute an offer or solicitation to buy financial products. This article is for general informational purposes only, and there is no explicit or implicit assurance or guarantee regarding the fairness, accuracy, completeness, or correctness of this article or the opinions contained therein. It is advised not to rely on the fairness, accuracy, completeness, or correctness of this article or the opinions contained therein. Please note that this article is neither investment advice nor an offer or solicitation to acquire financial products or cryptocurrencies.
Before investing in crypto ETPs, potentional investors should consider the following:
Potential investors should seek independent advice and consider relevant information contained in the base prospectus and the final terms for the ETPs, especially the risk factors mentioned therein. The invested capital is at risk, and losses up to the amount invested are possible. The product is subject to inherent counterparty risk with respect to the issuer of the ETPs and may incur losses up to a total loss if the issuer fails to fulfill its contractual obligations. The legal structure of ETPs is equivalent to that of a debt security. ETPs are treated like other securities.
