- Performance: June saw significant negative impacts on Bitcoin and cryptoassets due to declining ETP flows, miner distributions, and increased selling pressure from BTC whales and government liquidations. Despite these challenges, Bitcoin's price corrections have made it more attractive and closer to fair value, with expectations of future price appreciation due to increasing supply scarcity. Major cryptoassets like Bitcoin and Ethereum were less affected than altcoins, but recent trends suggest a potential reversal in risk appetite and increasing performance dispersion among altcoins.
- Macro: US recession risks have recently increased with disappointing macro data from the US which have put pressure on Bitcoin and cryptoassets. Bitcoin’s performance continues to be dominated by changes in global growth expectations. Systemic risks to watch include a revival of US regional bank stress, French sovereign risks, and US Treasury illiquidity.
- Chain: June was characterized by selling activity from different entities including miners, whales/government entities and also ETP investors from mid-June onwards. Barring any renewed increase in global risk appetite, our base case still remains a short-term consolidation until the positive effect from the Halving starts to kick in around August 2024. That being said, valuations have become more attractive due to the recent correction and are now close to "fair value".
Chart of the Month
Performance
June was characterized by a confluence of factors that affected Bitcoin and cryptoassets negatively.
A deceleration in global ETP flows coincided with distributions from BTC miners amid declining mining revenues. In addition, BTC whales contributed to increasing selling pressure on exchanges that was exacerbated by larger bitcoin liquidations from US and German government entities.
However, these negative factors have led to very oversold conditions in June as explained here.
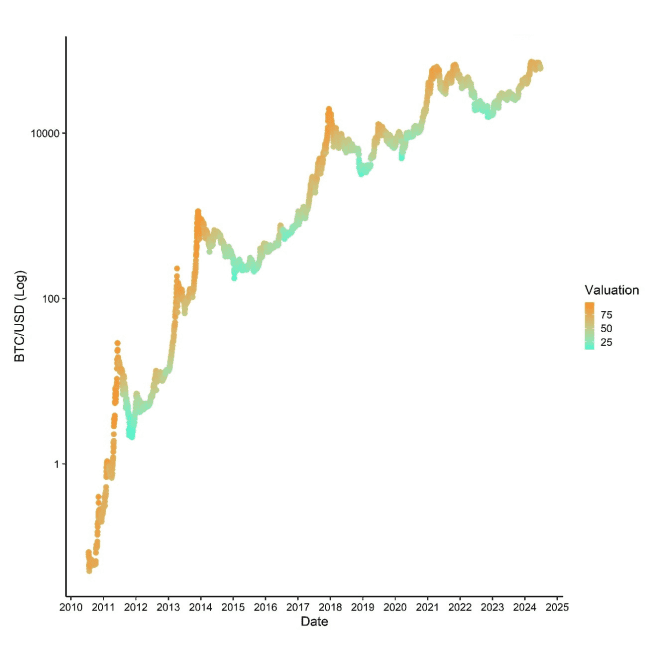
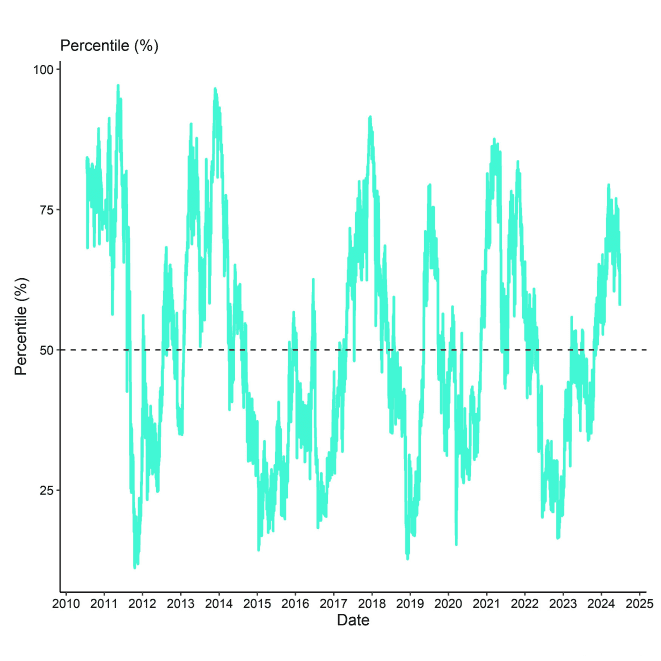
What is more is that the recent price corrections have made overall Bitcoin valuations more attractive again and closer to “fair value” based on our estimations.
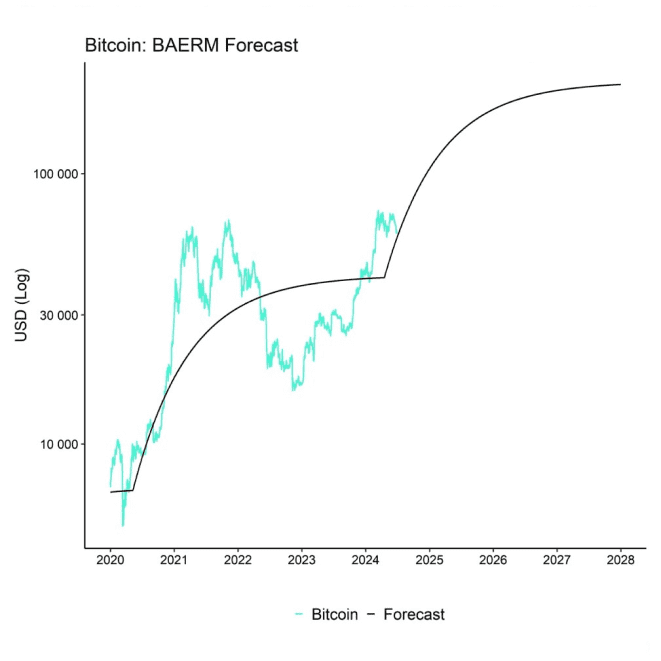
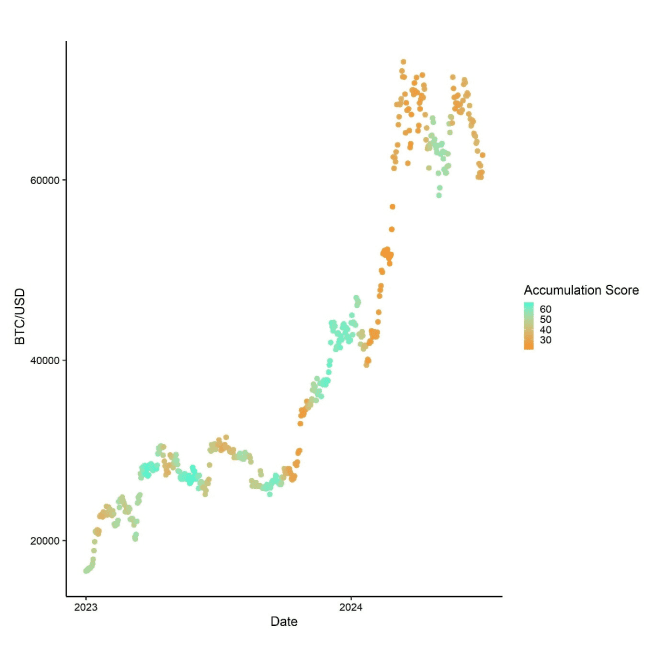
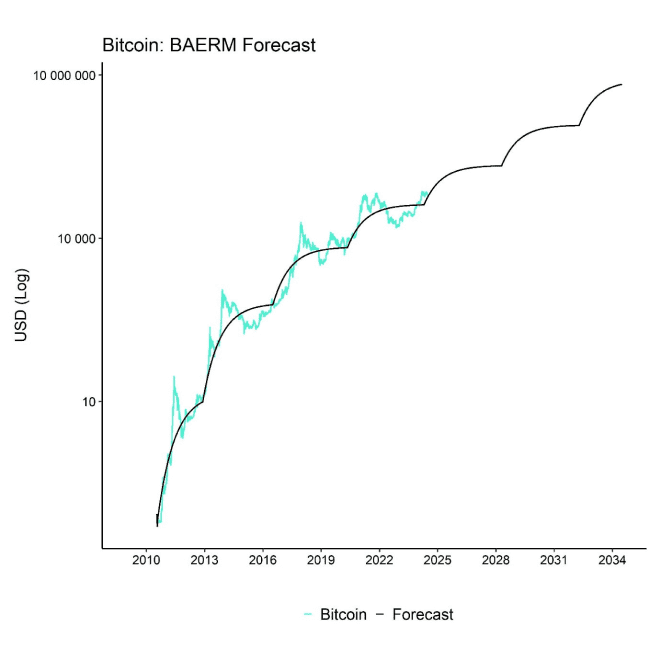
In fact, the recent price corrections have brought bitcoin’s price more in line what is implied by the Halving induced supply scarcity. We expect that the steady increase in Bitcoin’s supply scarcity will provide an increasing tail wind for further price appreciation (Chart-of-the-Month).
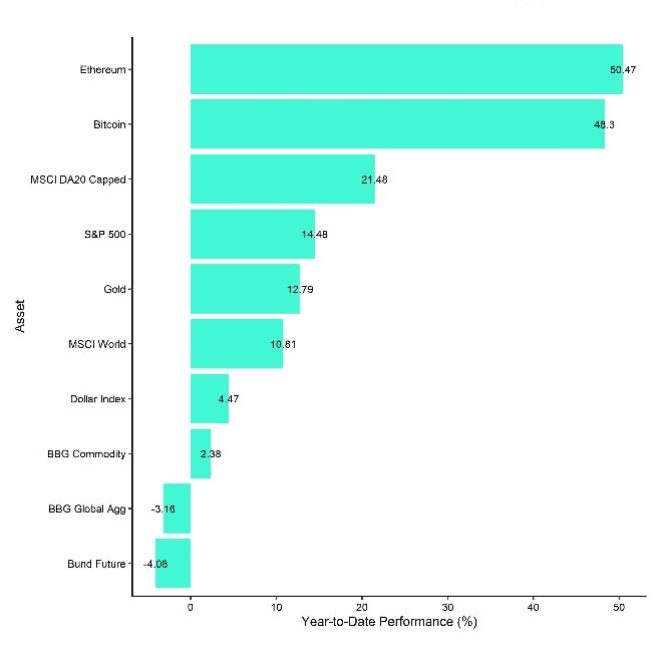
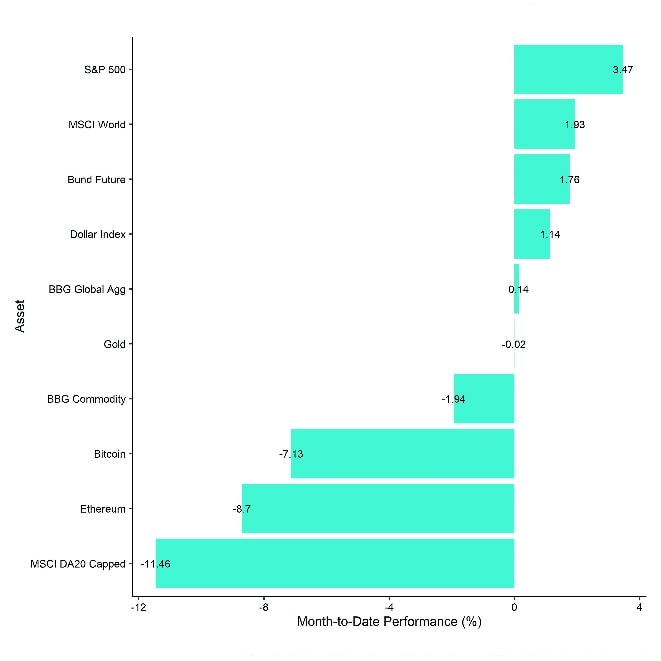
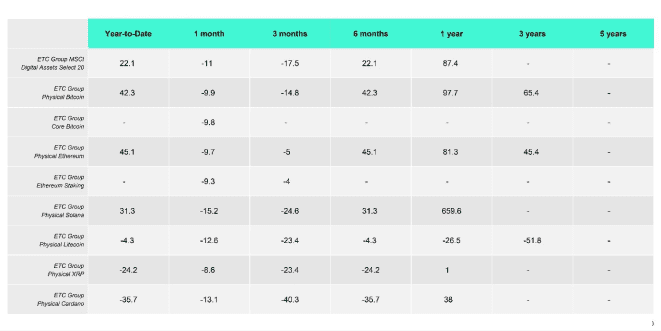
A closer look at our product performances also reveals that major cryptoassets like Bitcoin and Ethereum were less affected than other altcoins such as Solana or Cardano.
Important Notice: The ETC Group Metaverse UCITS ETF (METR LN) will be converted to the ETC Group Web 3.0 UCITS ETF (WEB3 LN) effective 1st of July 2024.
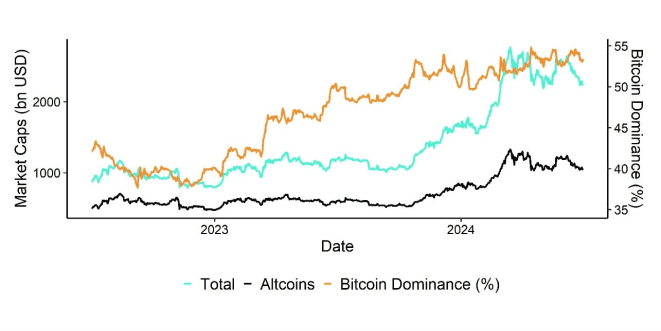
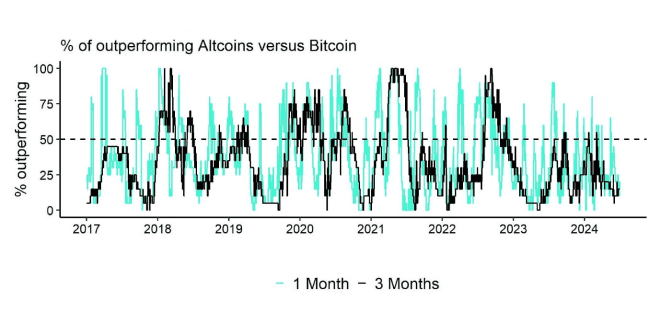
In fact, over the past month, altcoins majorly underperformed Bitcoin amid the general decline in risk appetite.
More specifically, only 15% of our tracked altcoins managed to outperform Bitcoin over the past month. However, there has been a significant reversal in altcoin outperformance more recently that could be a first sign of a fierce reversal in risk appetite.
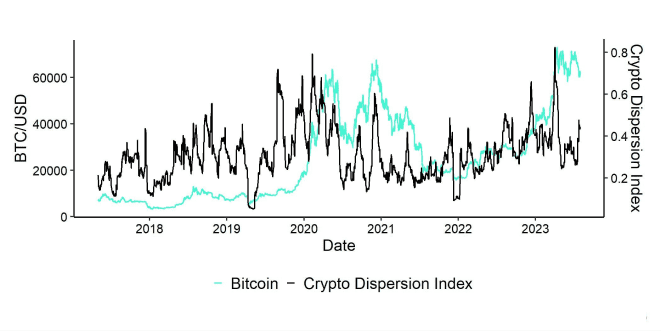
In addition, performance dispersion among different cryptoassets has also increased more recently which means that altcoins are starting to trade differently to Bitcoin and are becoming less correlated.
Bottom Line June saw significant negative impacts on Bitcoin and cryptoassets due to declining ETP flows, miner distributions, and increased selling pressure from BTC whales and government liquidations. Despite these challenges, Bitcoin's price corrections have made it more attractive and closer to fair value, with expectations of future price appreciation due to increasing supply scarcity. Major cryptoassets like Bitcoin and Ethereum were less affected than altcoins, but recent trends suggest a potential reversal in risk appetite and increasing performance dispersion among altcoins.
Macro Environment
The macro environment in June was mostly characterised by a worsening in sentiment as important leading indicators rolled over again. Most prominently, the ISM Manufacturing New Orders/Inventories ratio fell back to the lowest level since May 2023.
Other important leading indicators like University of Michigan Real Income Expectations or Pending Home Sales also rolled over signalling increasing risks of a recession. The renewed weakness appears to be broadening as leading indicators from different areas of the economy have decreased again – from manufacturing, over consumer sentiment, to the housing market.
As a result, the Bloomberg US ECO Surprise Index, which measures how important macro data releases have over- or underwhelmed consensus expectations has fallen to the lowest level since February 2019. Most of these negative surprises stem from a significant weakness in both housing & real estate market data and survey & business cycle indicators – leading indicators of the business cycle – while US employment data releases have continued to surprise to the upside.
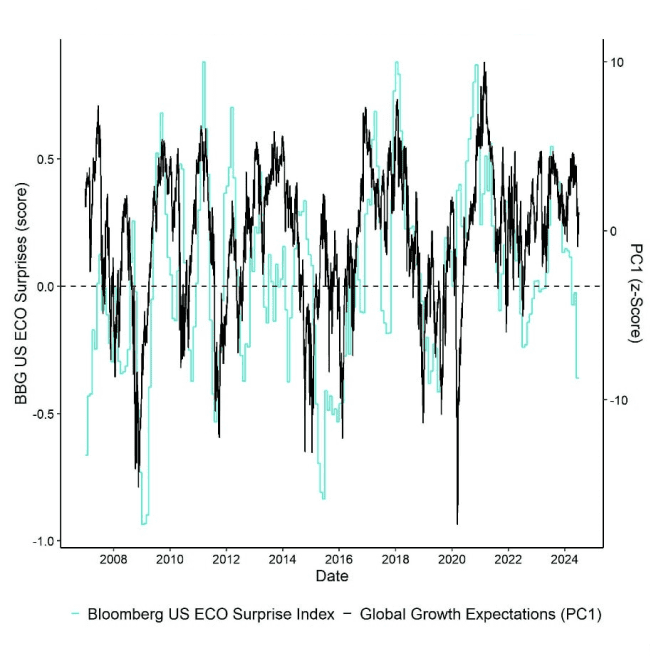
Because of the fact that US employment data generally comprise of lagging indicators with a few exceptions like initial unemployment claims, we expect that US employment data are likely going to deteriorate as well over the coming months, following the patterns observed in housing and other leading indicators.
What is more is that there is increasing evidence that the most recent employment data should be taken with a large grain of salt.
Although the latest headline non-farm payrolls number beat consensus expectations in May, the “small print” of the employment report has revealed that US labour market conditions are rather weakening significantly.
Consider the following employment data in May 2024:
- Non-farm payrolls with +272k significantly above consensus (180k) & above highest estimate
- March & April revised downwards by -10k and -5k, respectively
- Meanwhile, Household Survey employment change: -408k
- Full-time workers: -625k / part-time workers: +286k
In fact, the number of full-time workers is already contracting on a year-over-year basis which tends to be a recessionary signal itself.
Moreover, the most recent benchmark revisions have revealed that job growth in 2023 was overestimated by 770,000 jobs. In other words, about one in four jobs that was added last year never existed. It is comparable to eliminating three to four whole months of job growth in 2023.
Alternative data for job openings provided by LinkUp indicate that the top 10,000 companies are significantly cutting down their open roles.
In the context of recession signals it’s important to highlight that, although the widely-known “Sahm Rule” based on the unemployment rate has not yet been triggered, the lesser-known “Mel Rule” which is a representation of the Sahm Rule on individual state levels has already been triggered.
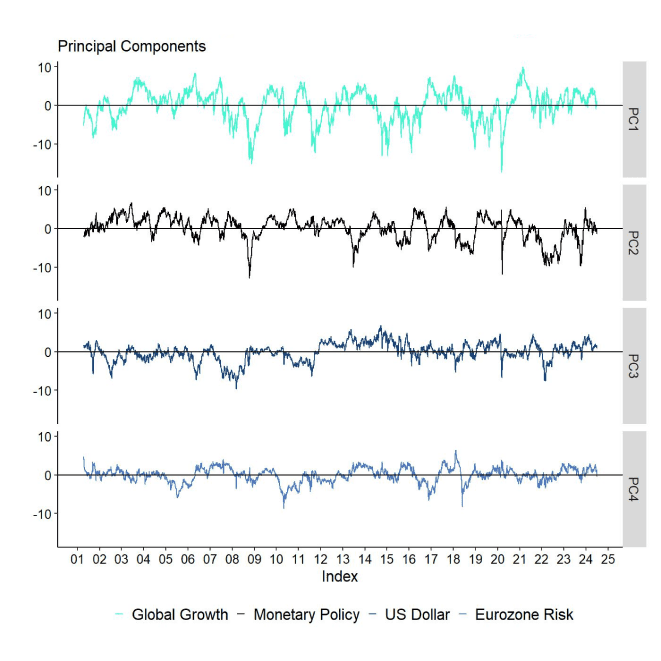
In any case, the negative growth surprises mentioned above have led to a further repricing of benign global growth expectations as market participants are increasingly factoring in a potential US recession as evidenced by our in-house indicator of global growth expectations (PC1).
Meanwhile, major US large cap equity indices rallied to new all-time highs in June. However, this happened on weakening market breadth as the bottom 490 stocks generally underperformed the top 10 mega caps in the S&P 500. So, deteriorating market breadth in traditional equities is also signalling increasing recession and correction risk.
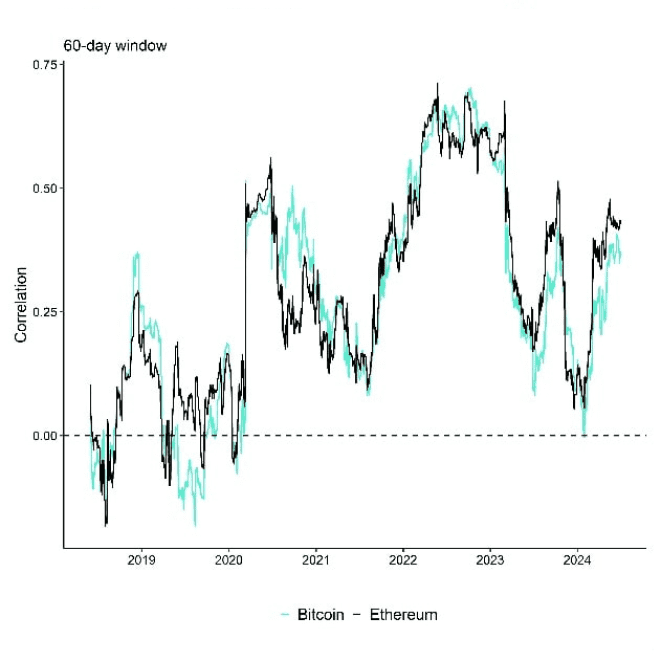
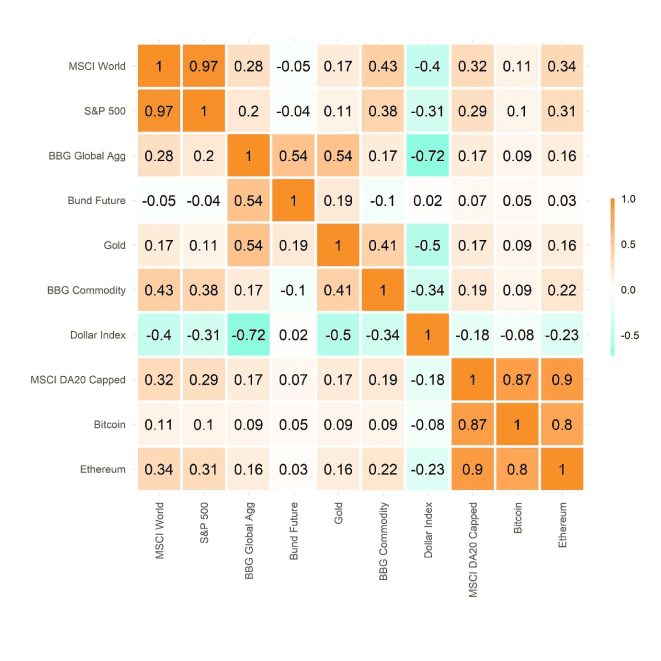
The risk for Bitcoin and other cryptoassets is that, firstly, major US large cap equity indices like the S&P 500 still exhibit a relatively high correlation to major cryptoassets.
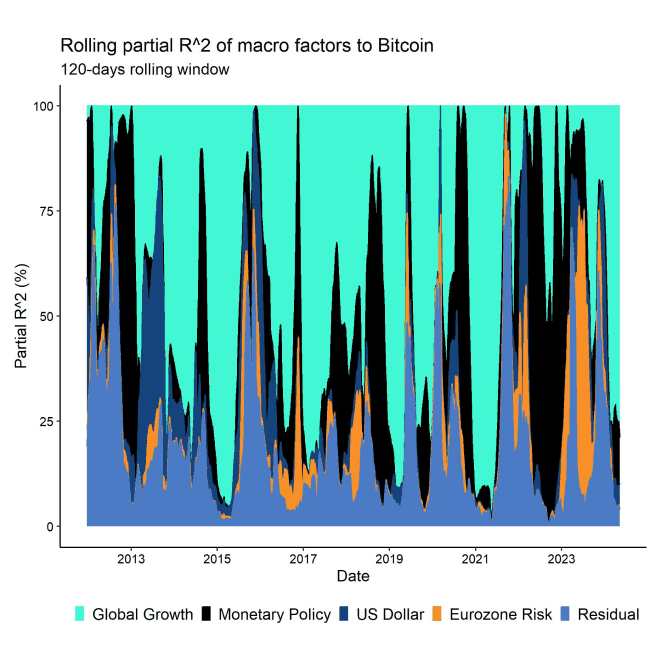
Secondly, global growth expectations are still the dominant macro factor for the performance of Bitcoin.
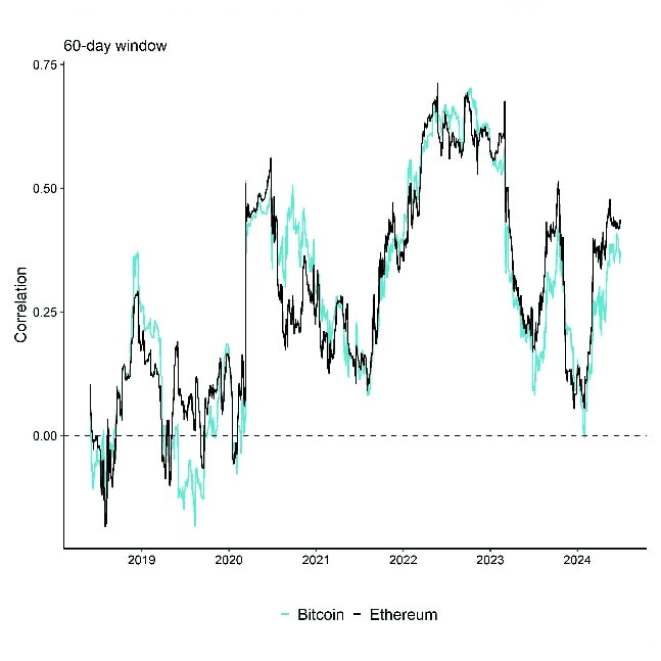
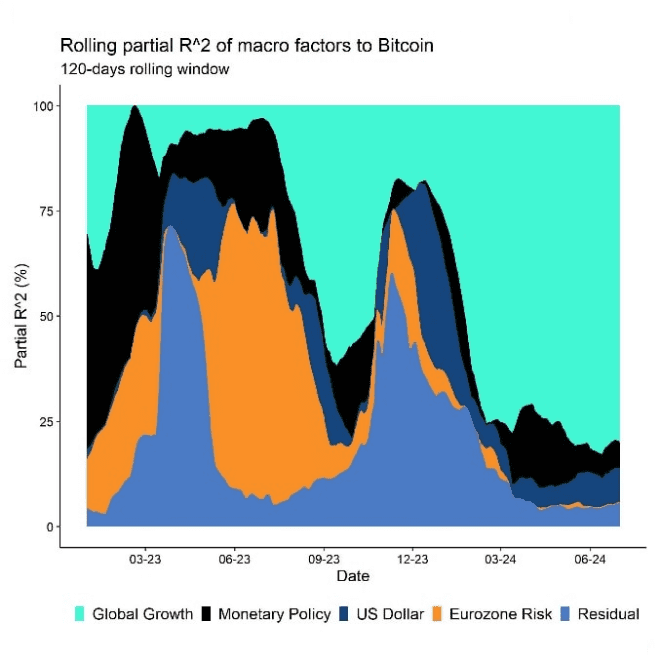
In this context, it is important to highlight that both the S&P 500 and Bitcoin are currently dominated by global growth expectations in terms of macro factors which explains the high correlation between both markets as well.
Hence, a further deterioration in global growth expectations could very well be a headwind for Bitcoin and cryptoassets over the coming months barring any changes in macro factor dominance.
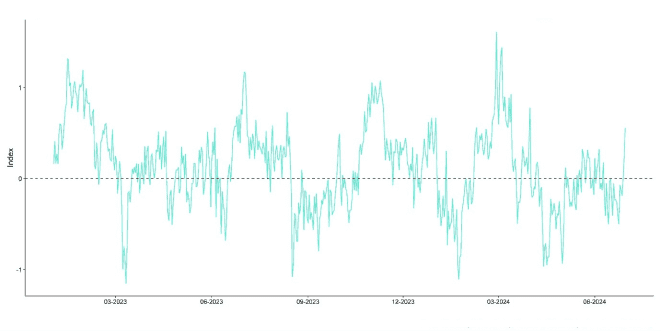
The good news is that Cryptoasset Sentiment has already declined significantly which means that investor positioning has become lopsided and sentiment very bearish. This implies that further downside risks for Bitcoin and cryptoassets appear to be relatively limited in the short term.
More recently, the Cryptoasset Sentiment Index has indeed sharply rebounded from these oversold levels already.
Another major topic is thepolitical uncertainty in France following the latest European elections with a general a victory of far-right parties which led incumbent president Macron to call for re-elections.
As a result, French government yield spreads to German Bunds have widened to the highest level since 2017 and 5-year Credit Default Swaps (CDS) which ensure against a sovereign default of the French government widened to the highest level since May 2020.
So far, there have not been widespread contagion of this event into other asset classes and the Euro (Dollar) has not depreciated (appreciated) significantly either.
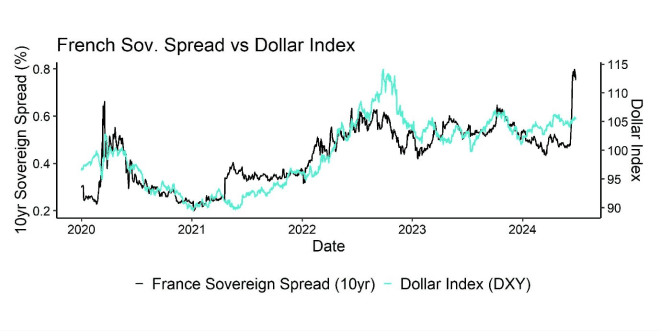
The risk is that this political uncertainty could spill over into economic uncertainty which would exacerbate current economic woes on the European continent.
Two important observations with respect to crypto markets are in order:
- If French political uncertainty spilled over into a weaker Euro/stronger Dollar and negatively affected global growth expectations, this would be a net headwind for Bitcoin and cryptoassets.
The reason is that periods of Dollar appreciation tend to be negative for the performance of Bitcoin. Bitcoin tends to thrive in a weak Dollar environment. - However, in case of a rise in systemic financial risks, we would expect Bitcoin to succeed and function as a hedge against systemic risks as well.
We have demonstrated how Bitcoin can serve as a hedge against rising sovereign risks in our latest Bitcoin Investment Case report as well.
So, there is generally some non-linearity in French political uncertainty – increasing uncertainty would likely be bearish for Bitcoin at first, but bullish for Bitcoin in case this would lead to an escalation in systemic financial risks.
There are other potential systemic risks that could support Bitcoin and cryptoassets.
One of these is the fact thatUS Treasury liquidity is currently worse than during the Covid-crisis in 2020. This could imply increasing Treasury volatility which could warrant a bond market intervention (read: “QE”) by the Fed in itself. This could also warrant interest rate cuts as happened in 2019.
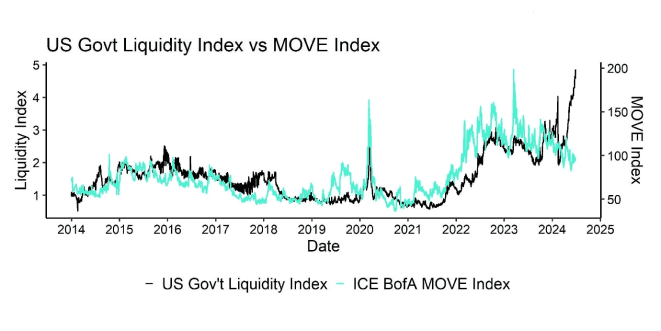
Consider the following precedent:
Interest rates on short-term loans between financial institutions known as overnight repurchase agreements, or "repos," saw an abrupt and unanticipated increase in September 2019. The Secured Overnight Financing Rate (SOFR), a gauge of the interest rate on overnight repos in the US, rose from 2.43 percent on September 16 to 5.25 percent on September 17. Interest rates increased to 10 (!) percent during the trading day.
The Effective Federal Funds Rate (EFFR) rose above the Federal Reserve's target range as a result of the activity, which also had an impact on the interest rates on unsecured loans between financial institutions. Economists later identified increased Treasury illiquidity as one of the causes of this spike in repo rates.
As a result, the Fed of New York intervened in the repo markets on September 17 and continued to do so every morning for the remainder of the week, injecting 75 bn USD in liquidity in response to this activity. The Federal Reserve's FOMC also reduced the interest rate on bank reserves on September 19.
In the end, these steps were effective in soothing the markets, and by September 20, rates had stabilised once more. Up to June 2020, the Fed of New York consistently supplied liquidity to the repo market.
It is important to highlight that this episode prompted another series of Fed interest rate cuts in 2019.
We think that such an event could repeat itself as the US Treasury’s borrowing needs are increasing rapidly amid higher interest payments on debt and refinancing needs while major foreign bond holders like China as well as the Fed are reducing their US Treasury holdings which could exacerbate illiquidity in the Treasury market.
If there was an escalation in the Treasury market it would most likely entail a renewed easing cycle by the Fed and a weak Dollar which would be bullish for Bitcoin and Cryptoassets.
Major central banks have already lowered interest rates this year such as the Bank of Canada, ECB or the SNB (twice). So, it appears as if the liquidity tide is already turning as pointed out in our lastBitcoin Macro Investor report in June.
We think that a potential US recession as well as the rising risk of a Treasury market dysfunction are among the main catalysts to watch for a final Fed pivot this year.
A US recession could also be caused by a renewed stress in the (regional) banking system which could lead to a subsequent credit crunch. The latest data by theFDIC imply that commercial banks in the US are still strained by high unrealized losses on their bond holdings. As of Q1 2024, unrealized losses on investment securities amounted to -516.5 bn USD. Despite the fact that the Fed has discontinued its Bank Term Funding Programme (BTFP) in March 2024 to help ease liquidity strains due to high unrealized bond losses, the underlying issues still exist today.
The latest deterioration in housing market data such as pending home sales, single-family building permits, or the NAHB housing market index spells additional trouble for regional banks as they tend to be highly leveraged to domestic real estate activity.
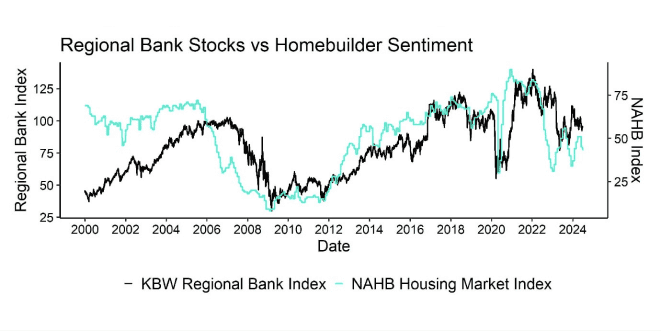
It is quite likely that housing market sentiment will continue to worsen as US consumers increasingly shun off buying homes as evidenced by the latest drop in University of Michigan Home Buying Conditions to a new all-time low.
Most recent housing market data releases have mostly surprised to the downside.
To sum up, these are the potential systemic risks that macro-focused cryptoasset investors should keep an eye on:
- US regional banking stress 2.0
- French sovereign risks
- US Treasury illiquidity
Bottom Line: US recession risks have recently increased with disappointing macro data from the US which have put pressure on Bitcoin and cryptoassets. Bitcoin’s performance continues to be dominated by changes in global growth expectations. Systemic risks to watch include a revival of US regional bank stress, French sovereign risks, and US Treasury illiquidity.
On-Chain Developments
June can generally be described as month that saw a confluence of selling pressure from different market participants.
Since the most recent Bitcoin Halving on April 20, bitcoin mining profits have dropped by -50% in bitcoin terms, placing a heavy burden on bitcoin miners' finances. Some Bitcoin miners were consequently compelled to turn off ineffective mining gear and sell into their stocks of BTC in order to pay for costs. More specifically, aggregate Bitcoin mining revenues have dropped to 26 mn USD per day which is significantly lower than the average of 39.6 mn USD per day over the past 365 days.
This observation is further supported by the fact that the smoothed Bitcoin hash rate has dropped by around -16% from its previous peak.
Furthermore, according to data from Glassnode, Bitcoin miners continued to sell into reserves and sold approximately -1.7k BTC of reserves and all of their mined supply (13.5k BTC).
Bitcoin miners have sold an average of 110% of their daily mining revenues over the past 30 days according to data provided by Glassnode.
A popular model to assess the risk of BTC miner capitulation is the hash ribbons signal put forth by Charles Edwards which simply measures the difference between the 30-day moving average of the hash rate and the 60-day moving average.
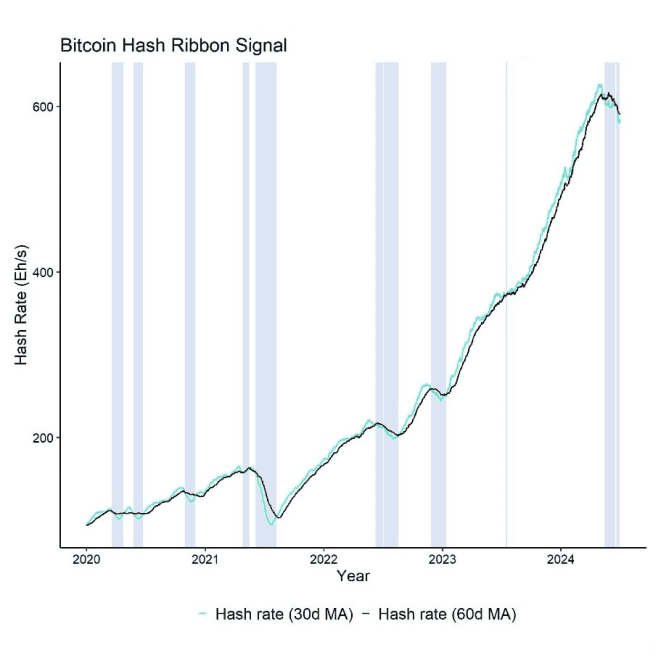
This difference is still negative implying a negative downtrend in overall network hash rate which means that miners are still taking inefficient mining rigs offline. A reversal in this signal would imply that the risk of additional miner distribution diminishes.
Another ongoing force of selling is the German government which has started distributing bitcoins it had previously seized during criminal prosecutions. At the time of writing, the German government still controls 46k BTC and has sold off only -4k BTC since it started distributing coins on the 19/06/2024 according to data provided by Arkham Intelligence.
That being said, the German government appears to be very cognizant of its price impact and is currently distributing coins via various exchanges and market makers such Coinbase, Kraken, Bitstamp and Flow Traders in an orderly way, so we shouldn’t expect large drawdowns from this particular distribution.
Despite some fake market rumours, the Mt Gox trustee has not been distributing bitcoins over the past few weeks and currently still controls around 142k BTC across different wallets according to data provided by Arkham.
However, the US government has also started distributing coins more recently which also weighed on market prices. In June, the US government had sold around 3940 BTC bringing its overall holdings to 214k BTC. The US government is still the biggest government entity worldwide controlling around 1.01% of total BTC supply followed by the Chinese government that controls 190k BTC (~0.90% of total supply).
Continued selling from US and German government entities could likely exert continued selling pressure on the market over the coming weeks.
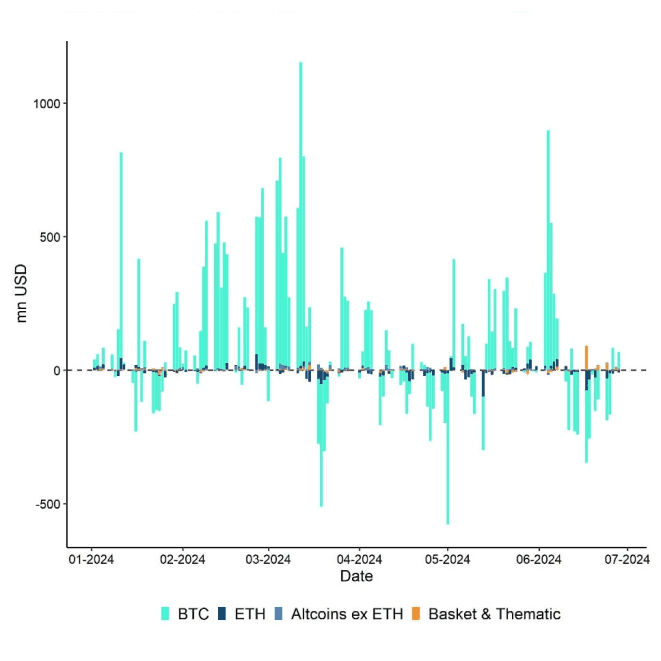
Another significant amount of selling pressure emanated from global crypto ETP outflows and US spot Bitcoin ETF outflows in particular. From mid-June until today, global crypto ETPs saw around -1.6 bn USD in net outflows of which -1.1 bn USD were related to US spot Bitcoin ETFs alone.
This was exacerbated by the fact that BTC whales increased their transfers to exchanges as well which tends to be bearish for prices as this increases supply liquidity on exchanges and indicate selling intentions. Whales are defined as entities that control at least 1,000 BTC.
Throughout June, whales have sent net 31.7k BTC to exchanges.
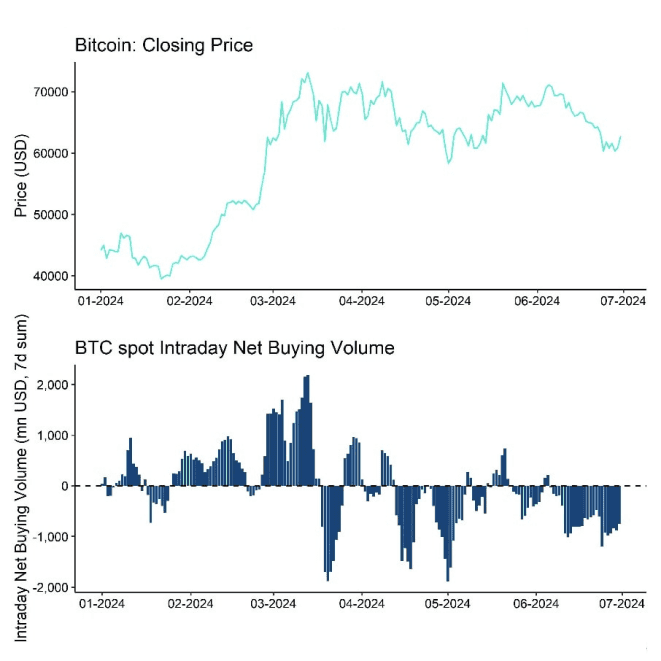
Overall, the distribution by the different entities mentioned above culminated in around -2.5 bn USD in net selling volumes on BTC spot exchanges in June.
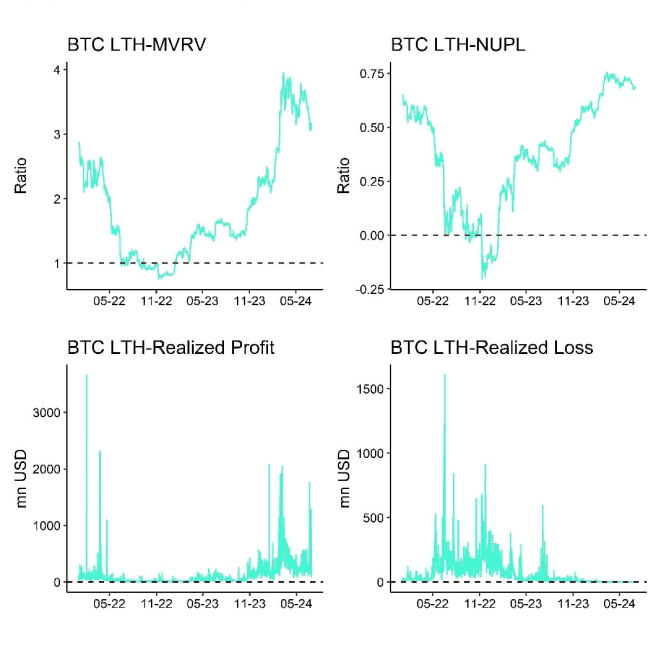
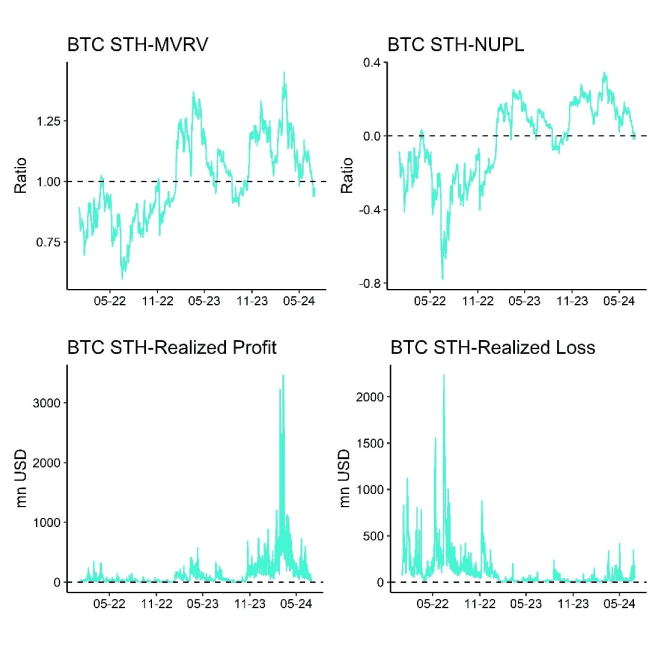
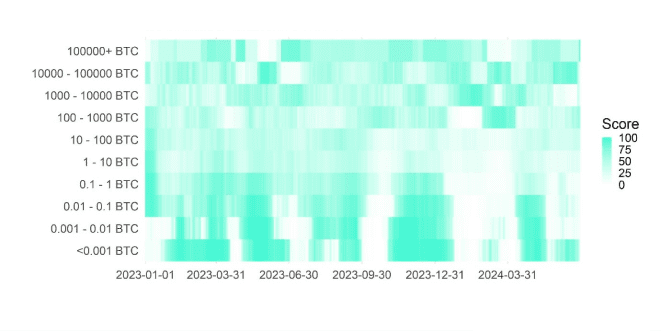
An analysis of the different investor cohorts implies that the recent selling mostly originated from large short-term holders (“whales”) which is evident in the fact that both realized losses of large wallet cohorts (holdings > 1,000 BTC) spiked with realized losses by short-term holders.
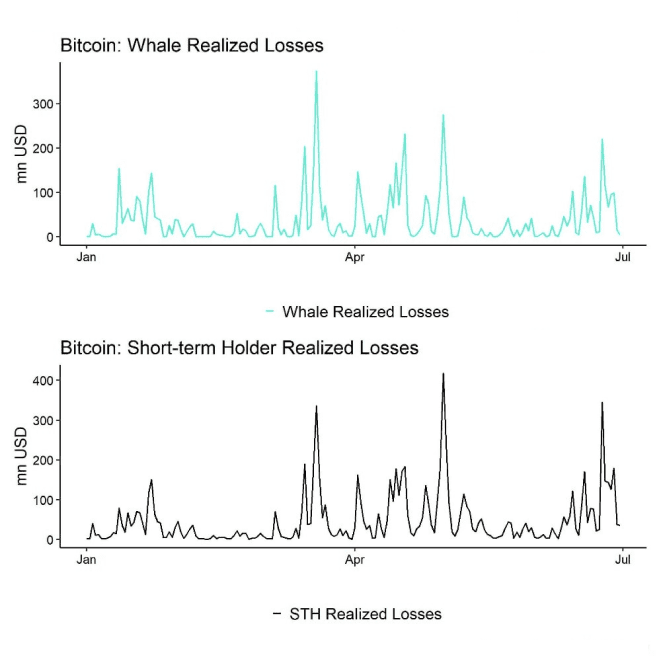
In this context, it is important to highlight, that large investors tend to exhibit rather short-term holding periods.
In plain English: Whales tend to be short-term traders.
The good news is that most of this selling appears to be exhausted as elaborated here. Short-term holders’ Spent Output Profit Ratio declined to 0.96 in late June, which implies that short-term investors have spent their coins at a -4% loss on average – they have literally "capitulated".
During the end of June, market positioning had generally become lopsided and sentiment had turned very bearish which tends to be a sign of a local bottom in the short term.
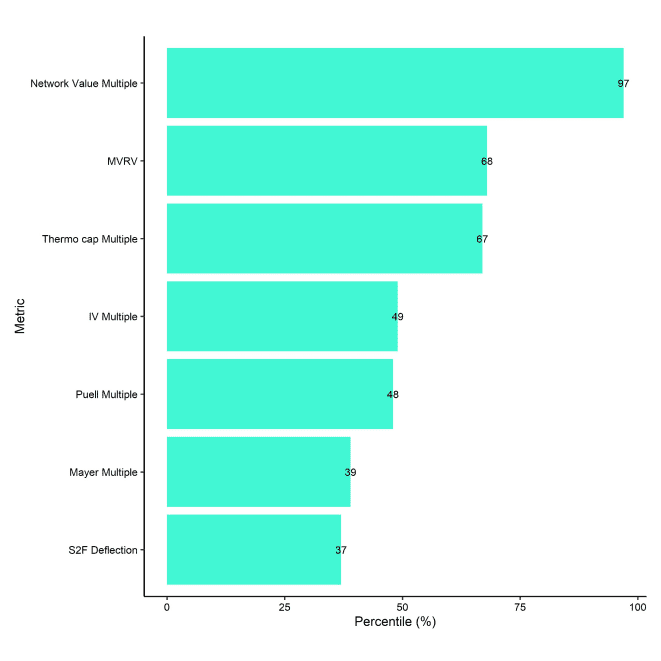
Another piece of good news is that Bitcoin valuations have become more attractive due to the latest correction. Our composite valuation indicator Bitcoin has fallen to 57% - close to “fair value”. What is more is that the price has also fallen back to the equilibrium price currently implied by the Bitcoin Autocorrelated Exchange Rate Model (BAERM). This means that increasing supply scarcity should gradually start to provide a significant tailwind for price appreciation over the coming months (Chart-of-the-Month).
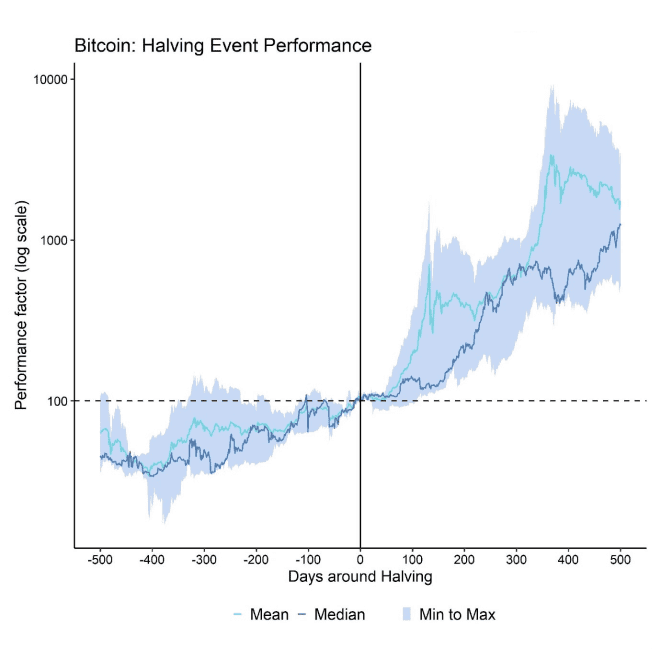
Over the medium term, we should see an increasing tailwind from the supply deficit induced by the Bitcoin Halving. We still expect the positive effect of the Halving to really take hold around 100 days after the event which would imply August 2024. Read more about the Halving effect here.
In the interim, a renewed uptick in net buying volumes on BTC spot exchanges is highly dependent on a renewed acceleration in US spot Bitcoin ETFs net inflows and return in global risk appetite which remains unlikely if the US slides into recession as we anticipate.
So, July could still be a month of continued consolidation which would also be consistent with the subdued seasonality pattern historically observed during the month of July.
Bottom Line: June was characterized by selling activity from different entities including miners, whales/government entities and also ETP investors from mid-June onwards. Barring any renewed increase in global risk appetite, our base case still remains a short-term consolidation until the positive effect from the Halving starts to kick in around August 2024. That being said, valuations have become more attractive due to the recent correction and are now close to “fair value”.
Bottom Line
- Performance: June saw significant negative impacts on Bitcoin and cryptoassets due to declining ETP flows, miner distributions, and increased selling pressure from BTC whales and government liquidations. Despite these challenges, Bitcoin's price corrections have made it more attractive and closer to fair value, with expectations of future price appreciation due to increasing supply scarcity. Major cryptoassets like Bitcoin and Ethereum were less affected than altcoins, but recent trends suggest a potential reversal in risk appetite and increasing performance dispersion among altcoins
- Macro: US recession risks have recently increased with disappointing macro data from the US which have put pressure on Bitcoin and cryptoassets. Bitcoin’s performance continues to be dominated by changes in global growth expectations. Systemic risks to watch include a revival of US regional bank stress, French sovereign risks, and US Treasury illiquidity
- On-Chain: June was characterized by selling activity from different entities including miners, whales/government entities and also ETP investors from mid-June onwards. Barring any renewed increase in global risk appetite, our base case still remains a short-term consolidation until the positive effect from the Halving starts to kick in around August 2024. That being said, valuations have become more attractive due to the recent correction and are now close to “fair value”.
Appendix
Cryptoasset Market Overview
Cryptoassets & Macroeconomy
Cryptoassets & Multiasset Portfolios
Cryptoasset Valuations
On-Chain Fundamentals
Important information:
This article does not constitute investment advice, nor does it constitute an offer or solicitation to buy financial products. This article is for general informational purposes only, and there is no explicit or implicit assurance or guarantee regarding the fairness, accuracy, completeness, or correctness of this article or the opinions contained therein. It is advised not to rely on the fairness, accuracy, completeness, or correctness of this article or the opinions contained therein. Please note that this article is neither investment advice nor an offer or solicitation to acquire financial products or cryptocurrencies.
Before investing in crypto ETPs, potentional investors should consider the following:
Potential investors should seek independent advice and consider relevant information contained in the base prospectus and the final terms for the ETPs, especially the risk factors mentioned therein. The invested capital is at risk, and losses up to the amount invested are possible. The product is subject to inherent counterparty risk with respect to the issuer of the ETPs and may incur losses up to a total loss if the issuer fails to fulfill its contractual obligations. The legal structure of ETPs is equivalent to that of a debt security. ETPs are treated like other securities.
 En
En  Fr
Fr  De
De 