- Ethereum has been consistently underperforming Bitcoin since Q4 2022, with the ETH/BTC ratio reaching multi-year lows.
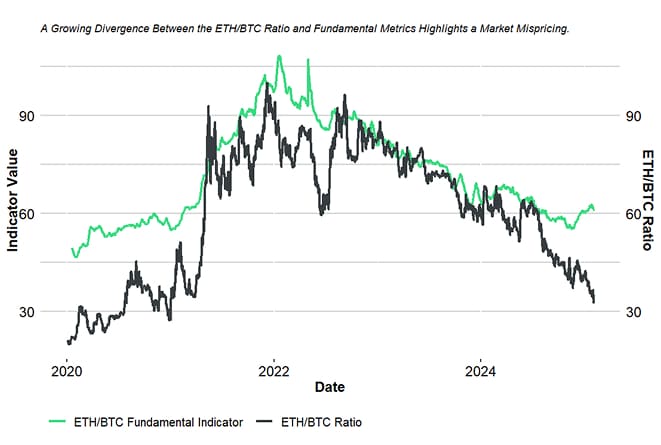
- Our ETH/BTC Fundamental Indicator suggests Ethereum is fundamentally mispriced relative to its on-chain activity and adoption metrics.
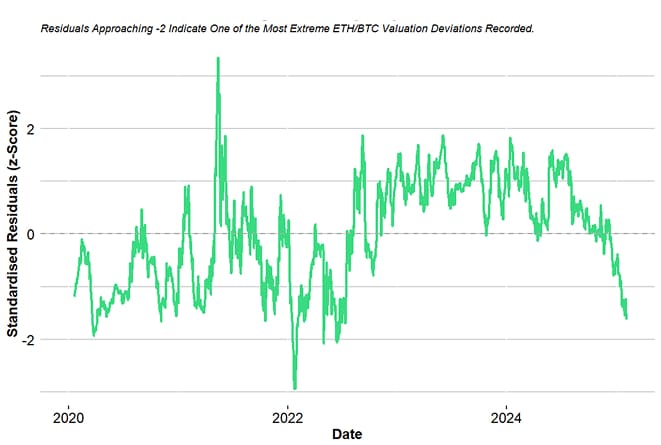
- Regression analysis confirms that Ethereum is significantly undervalued, with standardized residuals approaching -2, signalling an extreme deviation from its “fair value”.

Ethereum's underperformance relative to Bitcoin has been one of the most debated topics over the past two years. The ETH/BTC ratio has steadily declined, despite Ethereum's robust ecosystem growth, increased staking participation, and developer activity.
This raises a critical question:
Is Ethereum structurally losing value against Bitcoin, or is this a market mispricing?
To answer this, we developed the ETH/BTC Fundamental Indicator, which aggregates key on-chain and market-based metrics to determine whether Ethereum is undervalued relative to its fundamental activity.
The ETH/BTC Fundamental Indicator aggregates on-chain, market, and developer metrics to provide a quantitative view of Ethereum's fundamental health relative to Bitcoin.
Instead of weighting these indicators based on regression models, we opted for equal weighting, ensuring a balanced representation of fundamental activity without overfitting to past price trends.

To test whether Ethereum's price fairly reflects its fundamentals, we conducted a linear regression analysis between our composite indicator and the ETH/BTC ratio. The regression results provide strong statistical evidence that Ethereum is currently mispriced:
Our regression analysis reveals an intercept of -26.88, indicating that in the absence of fundamental activity, the ETH/BTC ratio would be substantially lower. The slope coefficient of 1.207 further underscores the market dynamics: for every one-point increase in the ETH/BTC Fundamental Indicator, the ETH/BTC ratio climbs by approximately 1.21 points, reflecting a strong positive relationship between fundamental activity and Ethereum's relative valuation. With an R² of 0.799, nearly 80% of the variation in the ETH/BTC ratio is explained by our indicator. Moreover, the exceptionally low p-values (below 2.2e-16) for both the intercept and slope confirm the statistical robustness of these findings, leaving little doubt that this relationship is not a result of random chance.

One of the most revealing insights comes from the standardized residuals of our regression model. The residuals indicate how much ETH/BTC is deviating from its fundamental fair value. When residuals fall below -2 standard deviations, it typically signals an extreme mispricing event.
Our latest analysis shows that the residuals are approaching -2, indicating that ETH is in one of the most extreme undervaluation zones in recent history. Statistically, this level of deviation occurs less than 5% of the time, making it a strong mean-reversion signal. If history is any guide, ETH/BTC is setting up for a high-probability reversal in trend.
Observation #1: ETH vs BTC transaction count

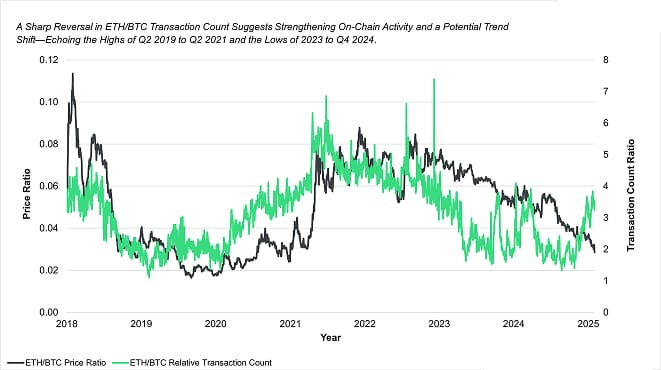
Transaction count is a critical metric for assessing network activity and adoption, as it represents the volume of transactions processed on a blockchain. A rising transaction count often correlates with increased utility and demand for the underlying asset. Historically, when Ethereum's relative transaction count has increased compared to Bitcoin, ETH/BTC has exhibited stronger performance.
In 2023, Ethereum's transaction count relative to Bitcoin declined significantly, aligning with ETH/BTC's broader downtrend. However, towards the end of 2024, a notable shift occurred. Ethereum's relative transaction count began to recover in Q4 2024, marking a sharp inflection point after a prolonged period of decline. This reversal in transaction activity echoes similar historical trends seen during Q2 2019 to Q2 2021, when ETH/BTC also experienced an extended rally. Conversely, periods of declining transaction dominance-such as in 2023 through Q4 2024-have historically coincided with ETH/BTC underperformance.
Observation #2: February Outlook
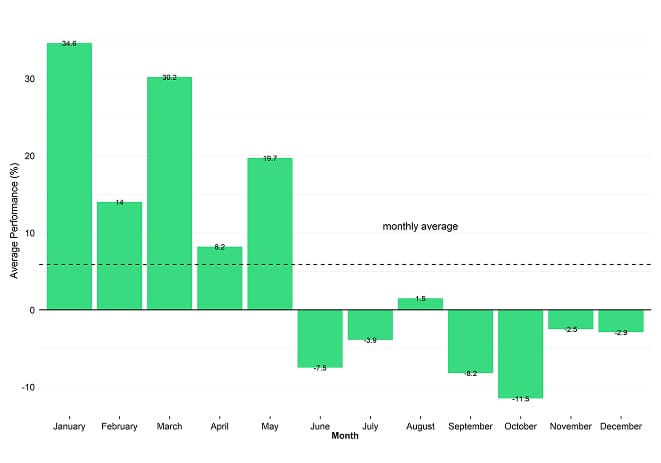
Historical seasonality suggests that ETH/BTC is poised for a potential rebound in February. Furthermore, Ethereum's standalone February seasonality has been consistently strong , with 7 of the last 8 years posting positive returns. While this does not guarantee ETH/BTC outperformance, it suggests seasonal strength could provide a favourable backdrop for a shift in its trajectory.

At the same time, our ETH/BTC Fundamental Indicator highlights a growing divergence, with increasing on-chain activity failing to be reflected in price action. This aligns with our regression analysis, which shows ETH/BTC residuals approaching -2 standard deviations-a threshold historically associated with extreme mispricing events. As noted earlier, while past instances of such deviations have not always led to an immediate recovery, they have typically signalled a high-probability reversal in trend.
Despite these signals, several structural factors have contributed to Ethereum's recent underperformance relative to Bitcoin. The rise of Layer 2 scaling solutions has fragmented activity across multiple ecosystems, limiting the value directly captured by Ethereum's base layer. Additionally, market narratives have shifted toward sectors like AI, memecoins, and real-world assets-areas that benefit from lower transaction costs, leaving Ethereum's often congested and expensive network at a disadvantage. Furthermore, Ethereum's extensive use as a trading pair across the crypto ecosystem has made it susceptible to persistent downward pressure from arbitrage whenever its price rises.
Yet, despite these headwinds, Ethereum remains significantly undervalued relative to its network fundamentals. As outlined in our regression analysis, ETH/BTC is trading at a historically deep valuation discount, reinforcing the potential for a fundamental re-rating in the coming months as the market begins to recognize Ethereum's improving metrics.
Bottom Line
- Ethereum has been consistently underperforming Bitcoin since Q4 2022, with the ETH/BTC ratio reaching multi-year lows.
- Our ETH/BTC Fundamental Indicator suggests Ethereum is fundamentally mispriced relative to its on-chain activity and adoption metrics.
- Regression analysis confirms that Ethereum is significantly undervalued, with standardized residuals approaching -2, signalling an extreme deviation from its “fair value”.
Important information:
This article does not constitute investment advice, nor does it constitute an offer or solicitation to buy financial products. This article is for general informational purposes only, and there is no explicit or implicit assurance or guarantee regarding the fairness, accuracy, completeness, or correctness of this article or the opinions contained therein. It is advised not to rely on the fairness, accuracy, completeness, or correctness of this article or the opinions contained therein. Please note that this article is neither investment advice nor an offer or solicitation to acquire financial products or cryptocurrencies.
Before investing in crypto ETPs, potentional investors should consider the following:
Potential investors should seek independent advice and consider relevant information contained in the base prospectus and the final terms for the ETPs, especially the risk factors mentioned therein. The invested capital is at risk, and losses up to the amount invested are possible. The product is subject to inherent counterparty risk with respect to the issuer of the ETPs and may incur losses up to a total loss if the issuer fails to fulfill its contractual obligations. The legal structure of ETPs is equivalent to that of a debt security. ETPs are treated like other securities.
 En
En  Fr
Fr 