- Performance: In May, Bitcoin and cryptoassets outperformed traditional assets like equities, with Ethereum leading due to the Ethereum spot ETF approval in the US. There was no significant altcoin outperformance indicating a broader risk appetite return.
- Macro: Market liquidity is shifting, yet growth outlooks remain positive despite risks from Chinese monetary policy tightening and a potential US recession. Yield curve steepening suggests a US monetary policy turnaround, likely only with a US recession.
- On-Chain: A short-term weakness is anticipated until the Halving's positive effects emerge around summer 2024. Contributing factors include slowing ETF and on-chain flows, heightened valuations, increased whale selling pressure, increasing macro risks, and unfavourable summer seasonality.
Chart of the Month
Performance
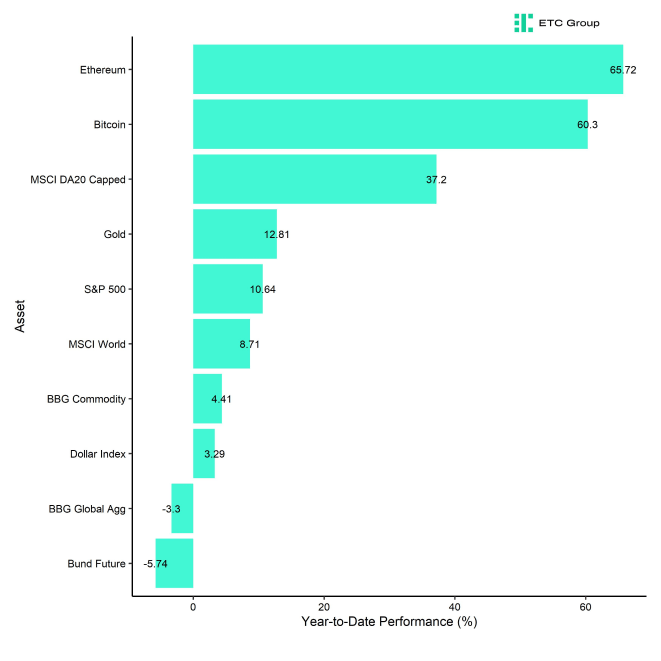
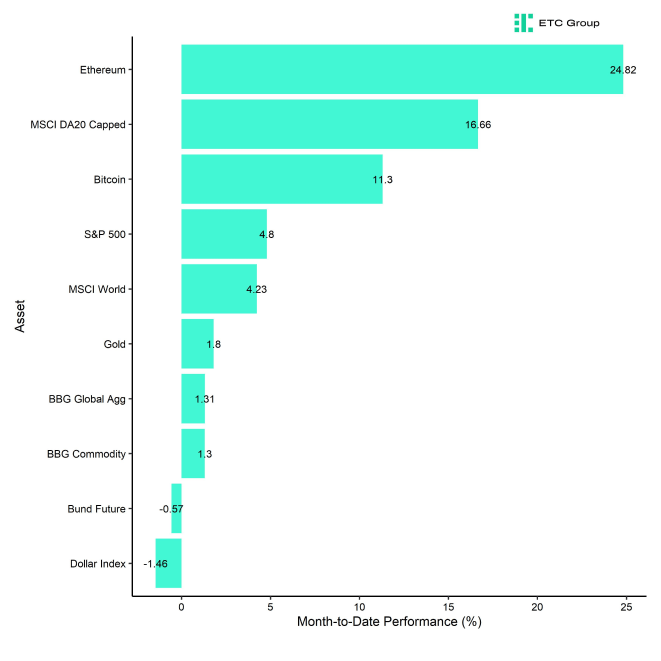
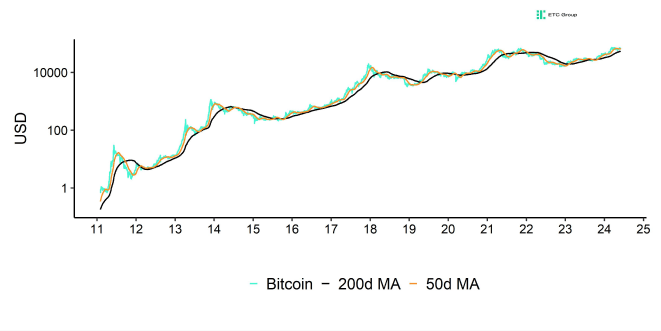
Last month, cryptoassets outperformed traditional assets like equities and bonds as Bitcoin recovered from oversold levels and improving news flow also helped.
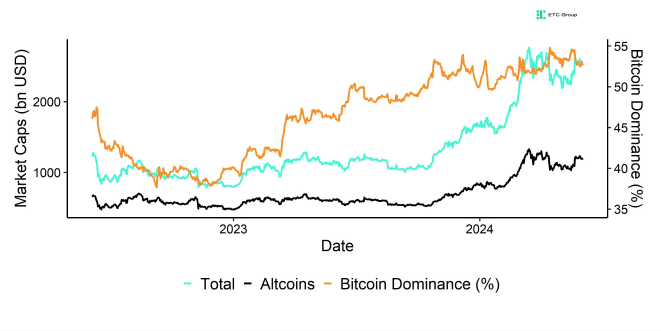
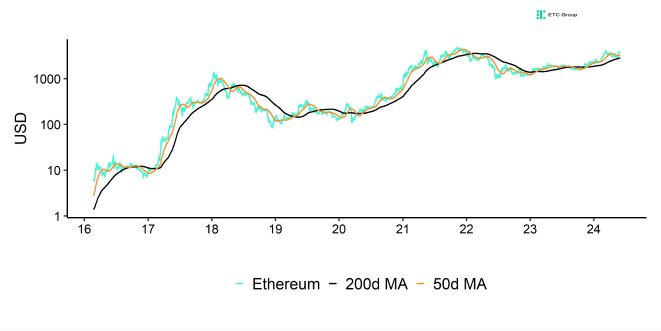
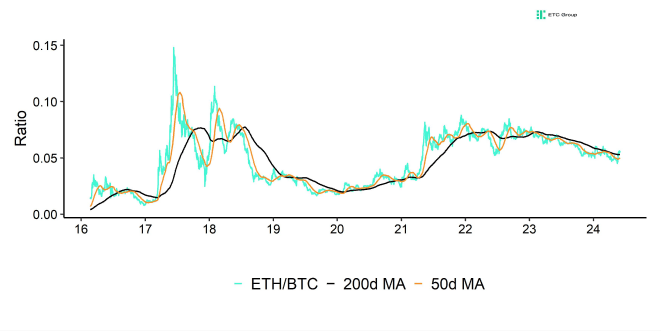
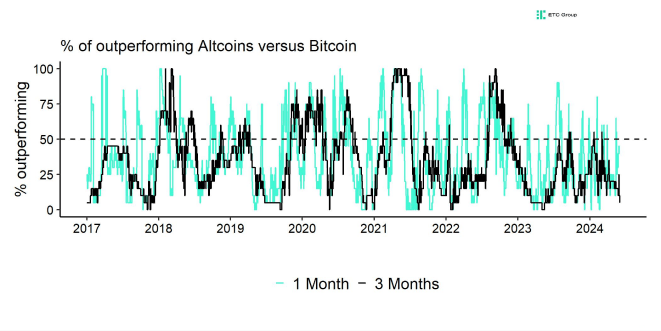
Ethereum was able to outperform Bitcoin due to the Ethereum spot ETF approval in the US. As a result Bitcoin's market cap dominance receded mostly in favour of Ethereum. Nonetheless, other altcoins managed to outperform Bitcoin only temporarily in May in a sign that risk appetite has not yet returned completely to overall cryptoasset markets.
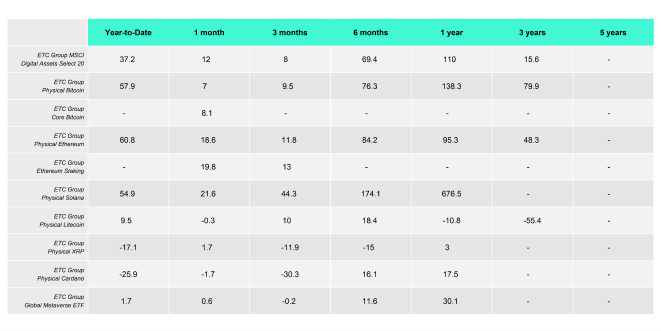
A closer look at our product performances also reveals that 1-month performances in May were relatively mixed. On the one hand, Solana and Ethereum managed to outperform Bitcoin while, on the other hand, other altcoins such as Litecoin or XRP significantly underperformed.
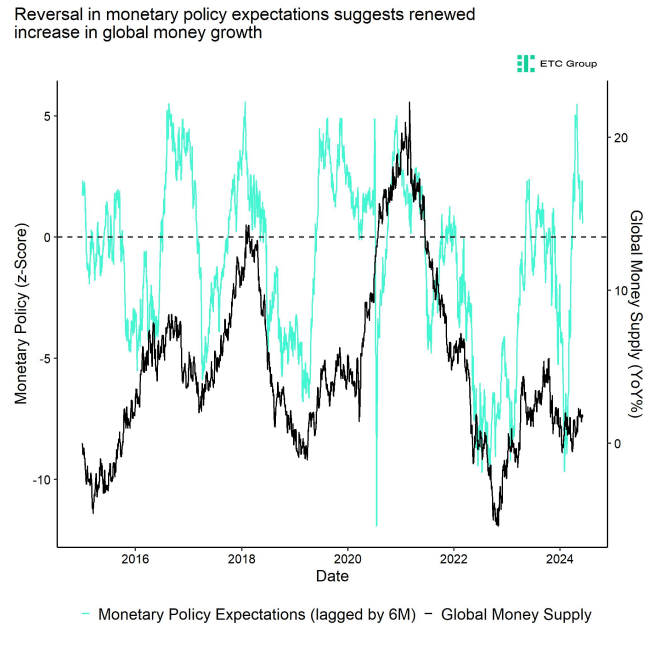
From a macro perspective, this could be due to the fact that broad macro liquidity growth has yet to show up in hard data. Although monetary policy expectations based on different financial market prices have eased considerably over the past months, global money supply growth is still relatively low (Chart-of-the-Month).
The prospects of a Fed interest rate cutting cycle is still buoying risk appetite in traditional financial markets and Fed Funds Futures are already pricing in the commencement of the cutting cycle until the end of 2024.
At the same time, US recession risks appear to be resurfacing as leading employment indicators have weakened again in May. Meanwhile, the Chinese growth reacceleration has led to a mini boom in cyclical commodity prices that jeopardizes Fed cuts via a renewed increase in inflation.
This report tries to look at different macro indicators such as global growth and monetary policy and weighs in these contradictory forces to give guidance on how this might affect Bitcoin and cryptoassets going forward.
Bottom Line: Bitcoin and cryptoassets outperformed traditional assets like equities in May. Ethereum outperformed Bitcoin due to the Ethereum spot ETF approval in the US. However, there was no broader altcoin outperformance in May that would suggest a decisive return in risk appetite.
Macro Environment
Probably one of the most frequently asked macro questions is whether a) the macro liquidity is indeed turning and b) how this could affect Bitcoin and cryptoassets going forward?
In fact, US M2 money supply growth has become positive in April 2024 for the first time since November 2022 after one of the longest contractions in US money supply ever.
This comes after one of the longest contractions in US broad money supply ever recorded.
Other alternative indicators have been signalling a return in macro liquidity as well. For instance, the recent in increase in aggregate stablecoin market caps across the biggest stablecoins USDT, USDC, and DAI is also evidence for this increase in overall macro liquidity.
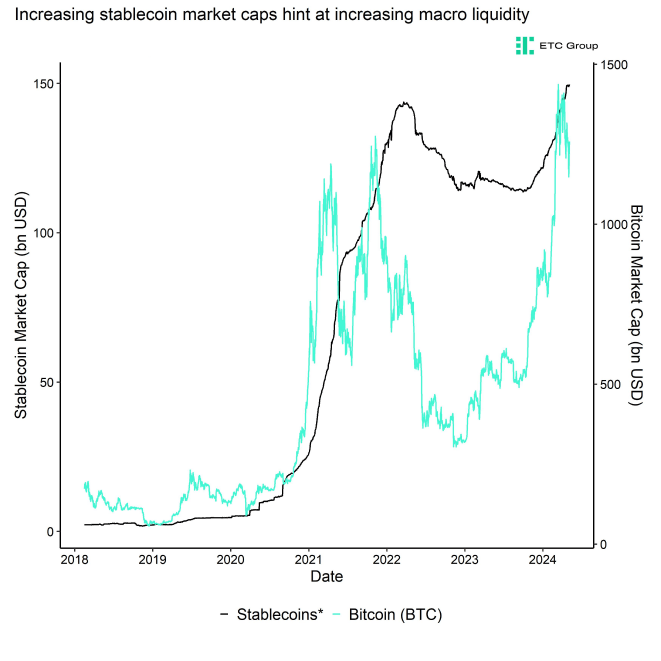
This increase in aggregate stablecoin market caps has also coincided with a commencement of the Bitcoin bull market from 2023 onwards.
The reason why this return in macro liquidity is important is that there is generally a close relationship between the performance of Bitcoin and cryptoassets and money supply/liquidity growth metrics.
In fact, Bitcoin's performance has historically been closely aligned with the ebbs and flows of global money supply growth.
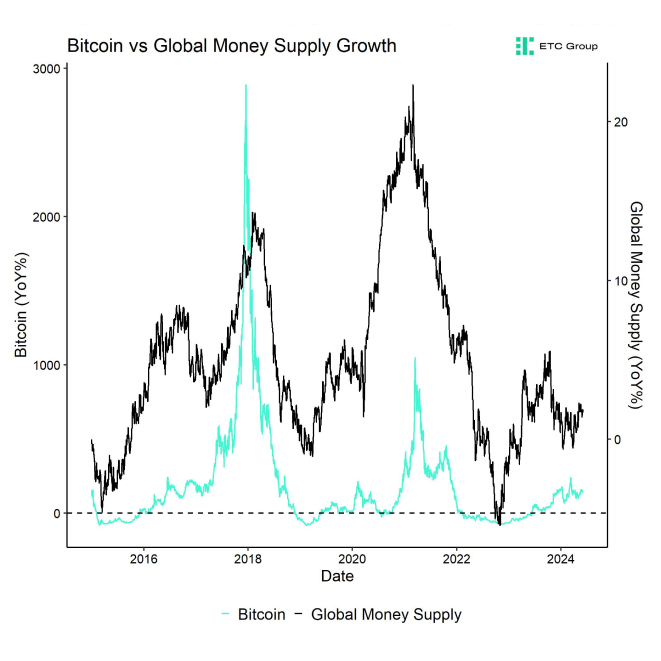
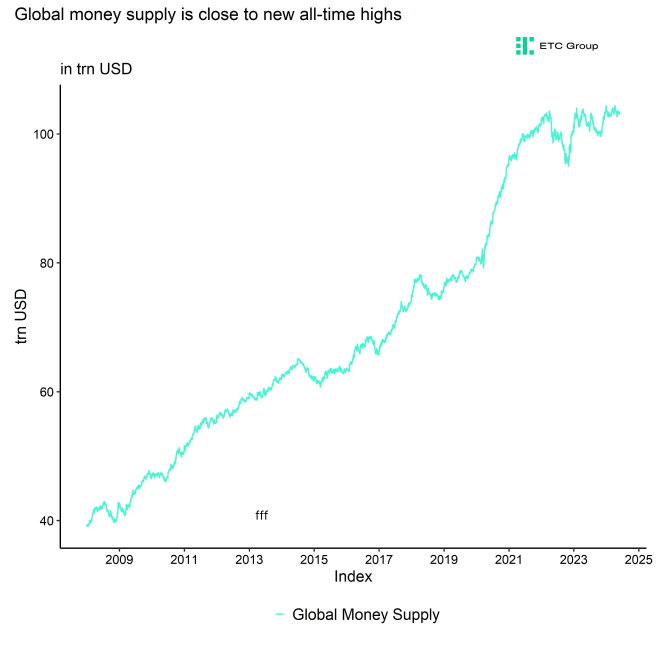
In fact, while US money supply seems to be bottoming out and rising again, global money supply is already close to new all-time highs and has already been accelerating since end of 2022 – consistent with the bottom in Bitcoin (in November 2022). At first sight, the fact that global money supply is close to its all-time high appears to be consistent with the fact that Bitcoin has just made new all-time highs as well.
How is this going to develop in the future?
However, it's important to note that financial market developments and monetary policy lead developments in hard data like global money supply growth.
Based on a daily gauge of the stance of monetary policy expectations that is derived from financial market prices, monetary policy expectations have signalled a renewed acceleration in global money supply growth.
This recent easing in monetary policy expectations has yet to show up in hard data like money supply growth.

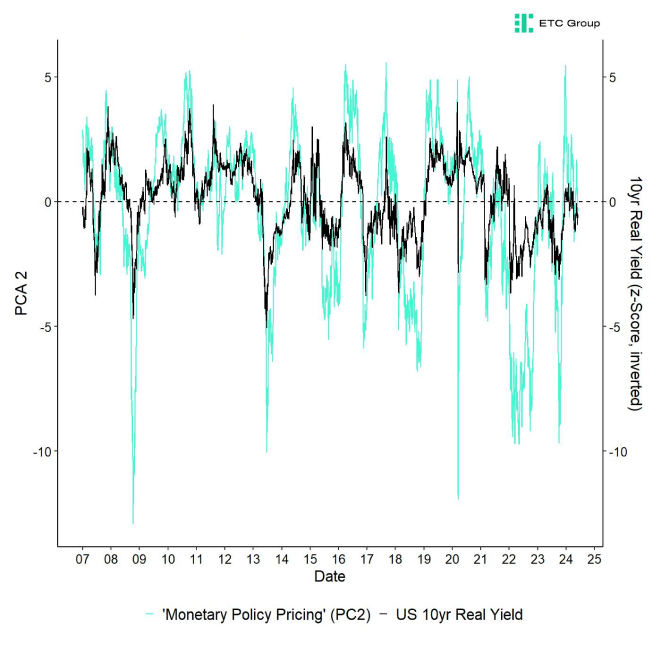
The reasons for this shift in monetary policy expectations is due to the fact that markets have generally rallied in anticipation of a final Fed pivot in monetary policy. For instance, markets are still pricing in a Fed interest rate cutting cycle.
At the time of writing, Fed Funds Futures are pricing in an additional cut more recently until December 2024 due to weaker-than-expected jobs and inflation numbers more recently. So, the market expects the Fed to commence the interest rate cutting cycle in 2024 already.
As a result, the US yield curve has also started to steepen as short-term rates have fallen faster than long-term yields in anticipation of these possible interest rate cuts.
This is consistent with an anticipated increase in US liquidity such as M1 money supply.
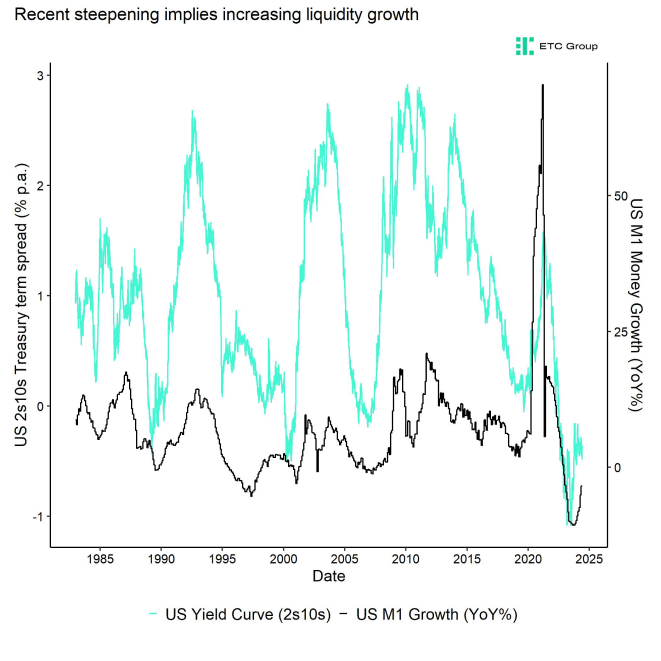
In general, there is also an inverse relationship between the short end of the yield curve and the steepness of the yield curve. In other words, the steepness of the yield curve is generally determined by the short end and ultimately the Fed Funds Rate.
How could this (anticipated) reversal in US monetary policy affect Bitcoin?
As a starter, Bitcoin' s sensitivity to monetary policy is not always straightforward and linear.
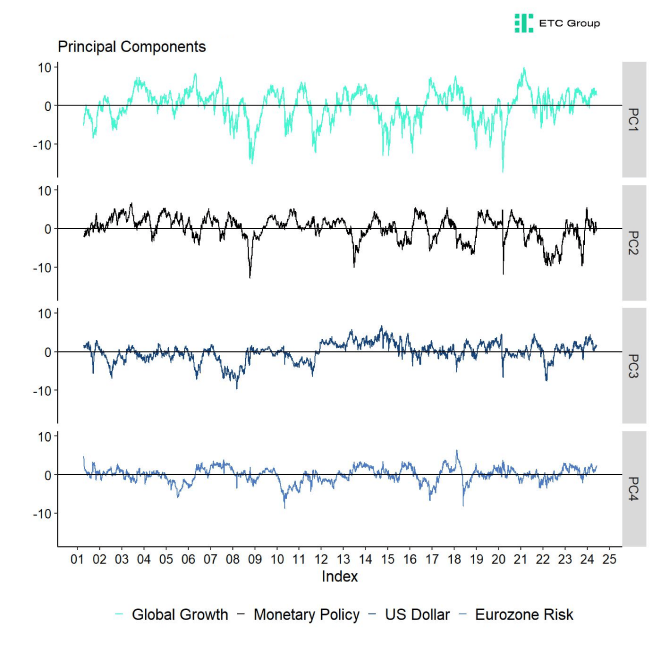
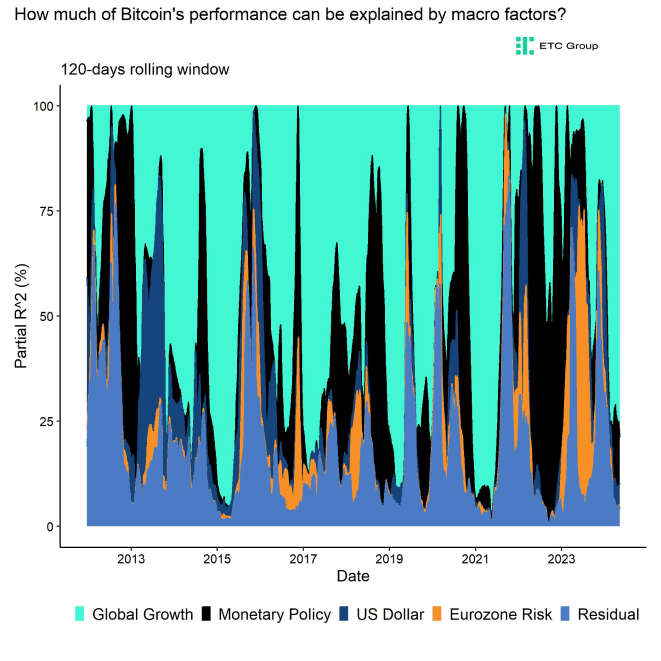
It is important to note that sometimes monetary policy can be important while sometimes global growth expectations or other macro factors can be more important. We speak of so-called "macro regimes".
Based on our calculations, over the past 120 trading days, around 82% of the performance of Bitcoin could be explained with changes in global growth expectations, not monetary policy!
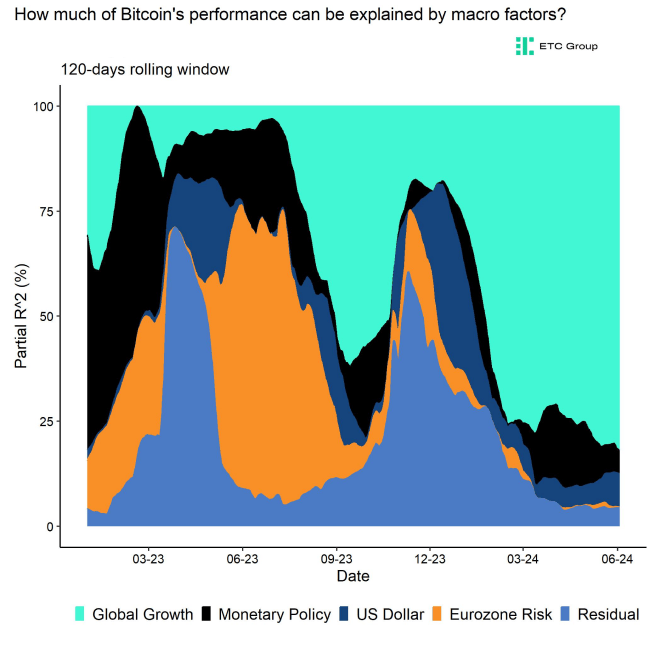
In fact, 2024 has so far turned out to be year where global growth expectations have been the most dominant macro factor so far. This is interesting inasmuch as rather coin-specific factors such the US spot Bitcoin ETF approval in the US in January or the Bitcoin Halving in April have so far not played an important role.
It seems as if the Chinese reflation and the US soft landing narrative have supported Bitcoin from the macro side in 2024.
That being said, residual non-macro factors like the Bitcoin Halving will probably become more significant for the performance of Bitcoin in late summer. In fact, changes in global growth expectations generally show a relatively high correlation with Cryptoasset Sentiment.
The correlation is around 0.4. In other words, macro sentiment (global growth expectations) tends to be correlated with Bitcoin & crypto sentiment.
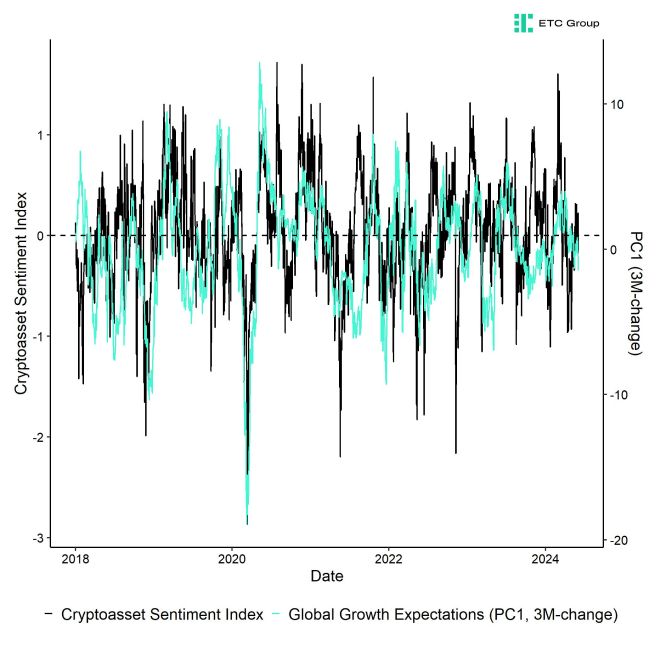
Now, financial markets have already priced in a lot of positive expectations about global growth.
In fact, they already have priced in a significant acceleration in leading indicators itself. The same is true for alternative high frequency macro indicators like the Copper-Gold ratio or the Aussie-Yen exchange rate.
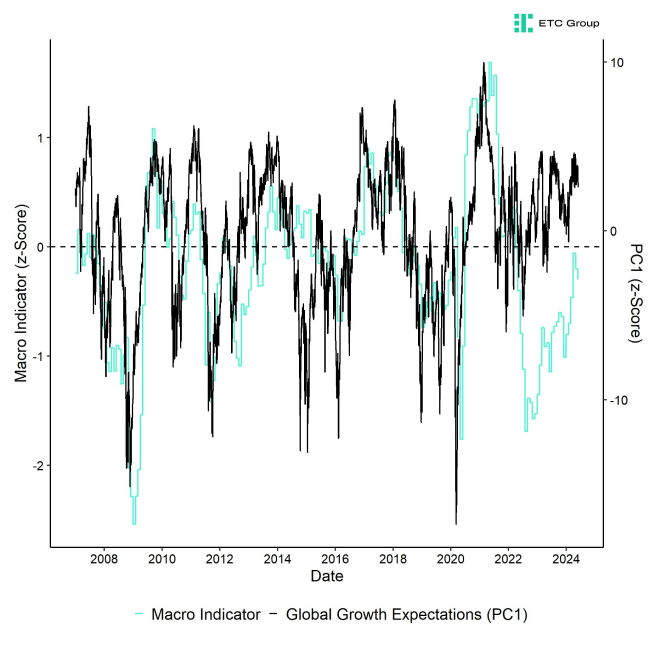
All of these indicators imply that markets are already pricing/expecting a pretty benign global growth picture. So, the risk appears to be asymmetrically to the downside.
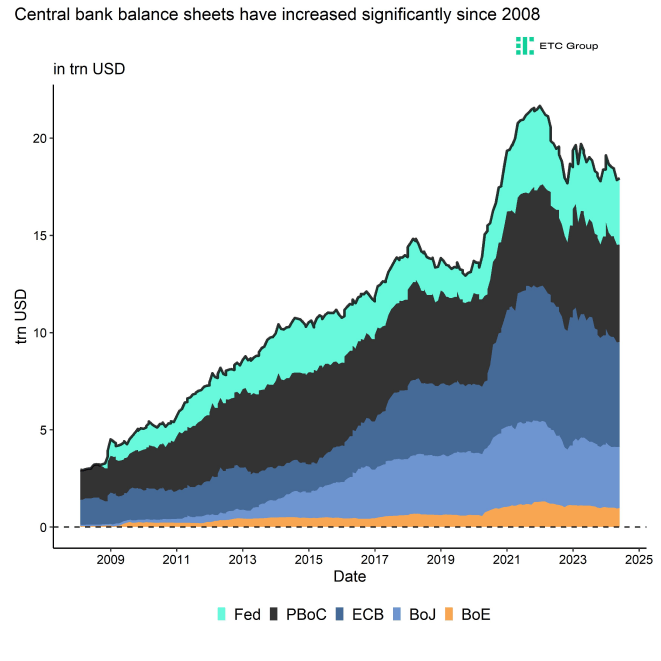
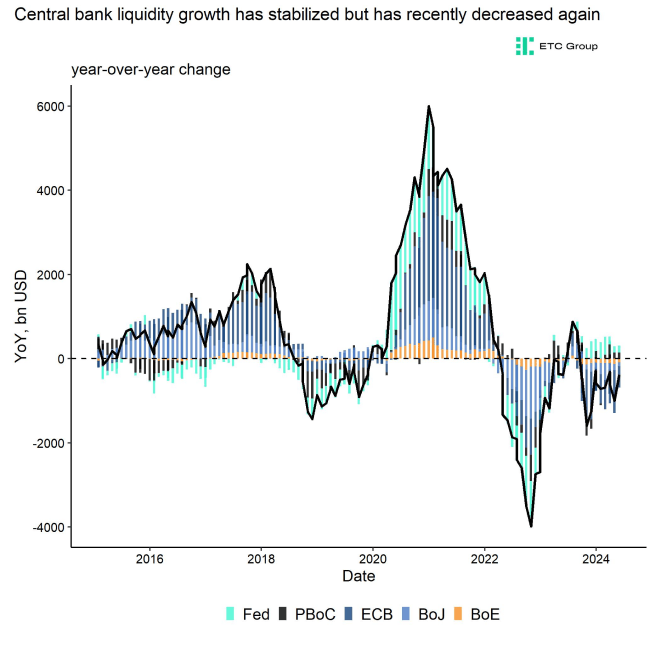
At the same time, G5 central bank balance sheets are on aggregate still stagnating.
The reason is not so much the Fed but mostly due to the fact that the Chinese PBoC is currently tightening monetary policy by withdrawing massive amounts of liquidity.
That being said, it's true that Chinese growth has been accelerating more recently judging by high frequency indicators such as Baltic Dry Index, Shanghai Containerized Freight Index or Copper itself.
Chinese manufacturing PMIs are also signalling expansion.
The Chinese credit impulse, which is a leading indicator for the Chinese economy and global manufacturing & commodity cycle is still contracting (<0%). Chinese M1 money supply growth is also contracting at a -1.4% YoY rate.
This implies that the recent acceleration in Chinese growth is most likely short-lived.
Coming back to US yield curve and potential turnaround in US liquidity. The same yield curve that implies an increase in liquidity can be used to predict a recession. The reason is that business and households hold higher levels of liquidity during recessions.
In fact, the NY Fed uses the US 2y10s term spread (i.e. yield curve) as well as a predictor of US recessions.
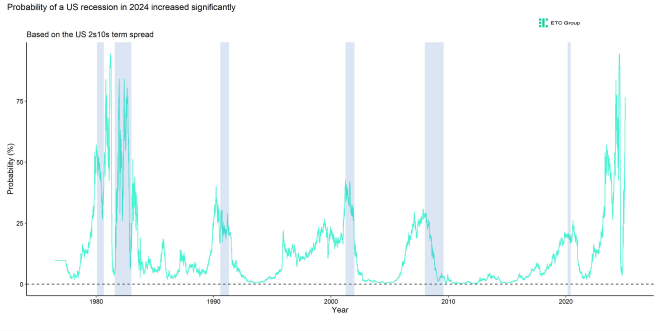
The US recession probability is still significantly above 50%.
We think that a contraction in US employment appears to be quite likely starting this summer. The following leading indicators are already signalling a contraction in US employment:
- NFIB Hiring plans
- ISM Manufacturing & Services Employment Indices
- “Mel Rule” and Unemployment changes
- NY Fed Consumer Expectations: Prob. of Losing Job minus Finding One
- Conference Board Consumer Survey: Jobs “hard to get” minus Jobs “plentiful”
For instance, the US economy has never avoided a recession without exception when the year-over-year %-change in unemployed persons was greater than 10% YoY. April's data have already surpassed this threshold with +10.5% YoY.
Although the potential catalyst that could tip the US economy into recession remains uncertain, it is quite likely that temporary higher bond yields due to a short-term increase in inflation could lead to a renewed resurfacing of (regional) banking troubles.
As of the end of Q1 2024, unrealized losses on securities held by commercial banks still amounted to 517 bn USD according to data by the FDIC. In other words, many commercial banks effectively remain significantly “under water” on their balance sheet. The Bank Term Funding Program (BTFP) has been discontinued by the Fed in March already, so any further strains could show up in regional bank stock prices such as the KRX Index down the road.
This is one of the primary high-frequency indicators that investors should keep an eye on as regional bank stocks tend to be a high-frequency indicator for both NFIB small business optimism and the NAHB housing market index.
𝗛𝗼𝘄 𝗰𝗼𝘂𝗹𝗱 𝗮 𝗽𝗼𝘁𝗲𝗻𝘁𝗶𝗮𝗹 𝗱𝗲𝗰𝗲𝗹𝗲𝗿𝗮𝘁𝗶𝗼𝗻 𝗶𝗻 𝗴𝗹𝗼𝗯𝗮𝗹 𝗴𝗿𝗼𝘄𝘁𝗵 𝗲𝘅𝗽𝗲𝗰𝘁𝗮𝘁𝗶𝗼𝗻𝘀 𝗮𝗻𝗱 𝗨𝗦 𝗿𝗲𝗰𝗲𝘀𝘀𝗶𝗼𝗻 𝗮𝗳𝗳𝗲𝗰𝘁 𝗕𝗶𝘁𝗰𝗼𝗶𝗻?
Unfortunately, we only have a single observation since Bitcoin's genesis in 2009. The Covid recession during 2020. Bitcoin sold off more than -50% before ending the year with a +300% performance. It is quite likely that we are looking at a similar playbook here.
The likeliest path remains short-term bearish on account of the abovementioned macro headwinds until the positive effects from the Bitcoin Halving are more widely felt in Bitcoin's performance and performance seasonality improves towards the end of the year.
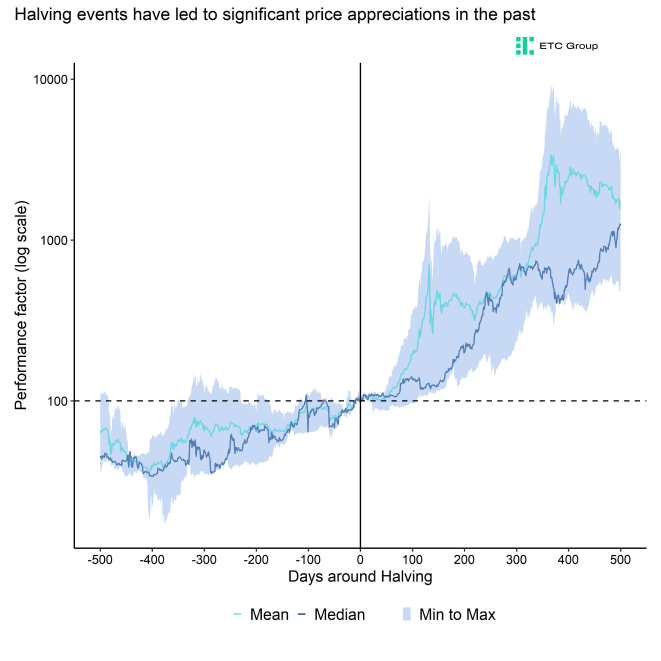
The positive effects from the Bitcoin Halving are usually to be expected around 100 days after the event which would imply August 2024 onwards. In other words, it is not priced in, yet. We have done a detailed analysis on the lagged Halving effect here.
The upside to this view is that negative macro factors could play less of a role with the positive Bitcoin Halving effect towards the end of the year.
Bottom Line: Liquidity tide is indeed turning but markets are already painting a pretty benign growth picture. Risks are to the downside given ongoing Chinese monetary policy tightening and increasing risks of a US recession. Yield curve steepening itself would imply turnaround in monetary policy which is only likely amid a US recession itself. Positive effects from the Halving will probably become visible from August 2024 onwards when macro factors could become less relevant for the performance of Bitcoin.
On-Chain Developments
On-chain developments remain rather lukewarm at the moment. It seems as if the market is still recovering from the ETF-related buying frenzy we saw until mid-March when Bitcoin also hit its latest all-time high.
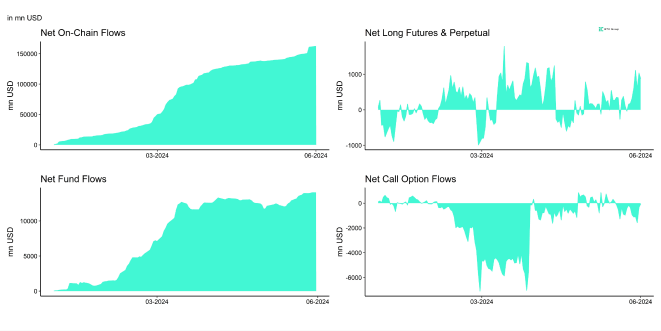
Although there is a renewed pick-up in capital flows more recently, the amount of capital invested into major cryptoassets like Bitcoin and Ethereum has generally slowed down significantly since mid-March.
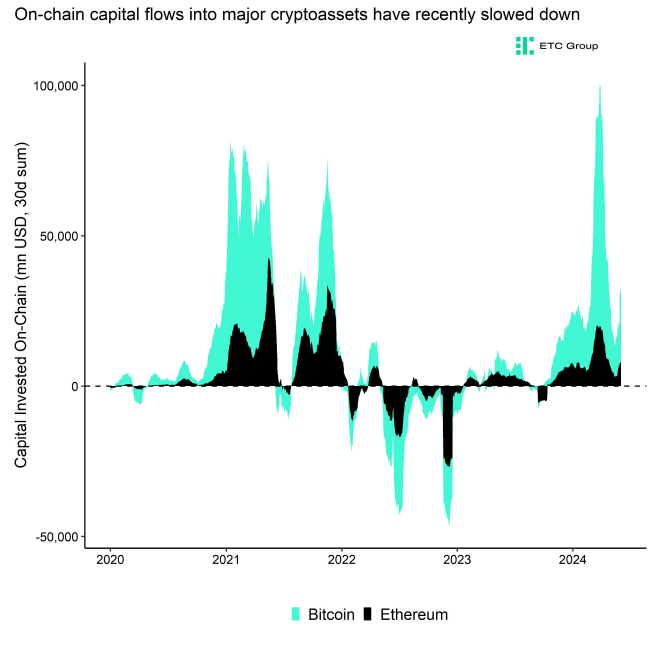
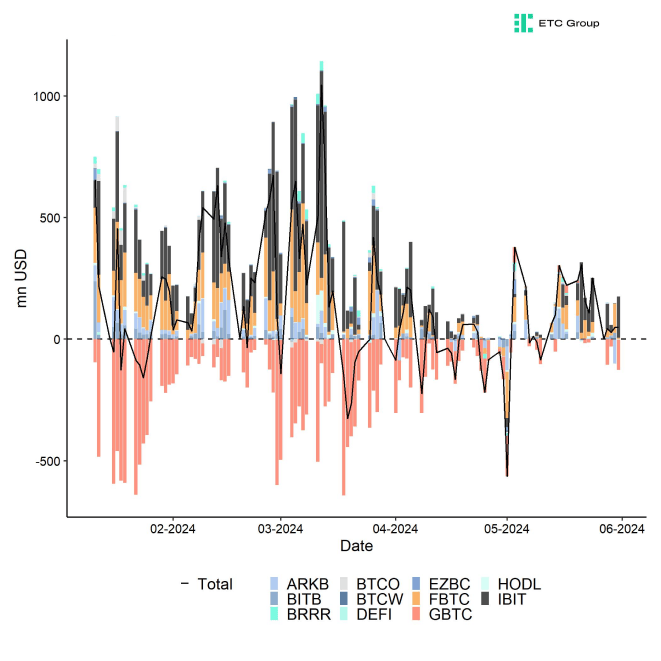
This is also consistent with the general observation that the pace of net inflows into US spot Bitcoin ETFs has also slowed down markedly in Q2 compared to Q1 2024. However, it is important to note that this slowdown in overall on-chain capital flows is not mainly related to the deceleration in spot Bitcoin ETF flows but mainly due to a slowdown in on-chain spot exchange volumes.
Although ETF flows played a much larger role in 2024, the majority of capital invested into Bitcoin year-to-date still came mostly via spot exchanges.
In fact, the cumulative amount of on-chain flows was almost 15 times larger than all cumulative global Bitcoin ETP net inflows in 2024 combined.
There are several short-term headwinds emerging on-chain which imply that risks are tilted to the downside.
Firstly, despite the fact that we saw decent net inflows into US spot Bitcoin ETFs, net buying minus selling volumes on spot Bitcoin exchanges have turned negative.
That being said, we still expect that the majority of US spot Bitcoin ETF flows is still ahead of us. Out of the 33.5 bn USD that we estimated before the start of the ETF trading launch (see outlook report here), so far only around a third have flown into US spot Bitcoin ETFs. More specifically, at the time of writing, around 13.7 bn USD have flown into US spot Bitcoin ETFs.
This will be accompanied by approximately 1.6 bn USD in US spot Ethereum ETF inflows 3 months after the trading launch as estimated here.
Nonetheless, it should be highlighted that especially the US ETF market remains dominated by retail investors. The latest 13F filings in the US have revealed that many institutional investors such as hedge funds and endowment funds have already gained exposure to Bitcoin ETFs as of the end of Q1 2024. However, they have also revealed that more than 80% of AuM is held by non-institutional investors that have not filed 13Fs, i.e. mainly retail investors.
Therefore, it is quite likely that US ETF flows will be highly procyclical and fluctuate with changes in overall risk appetite.
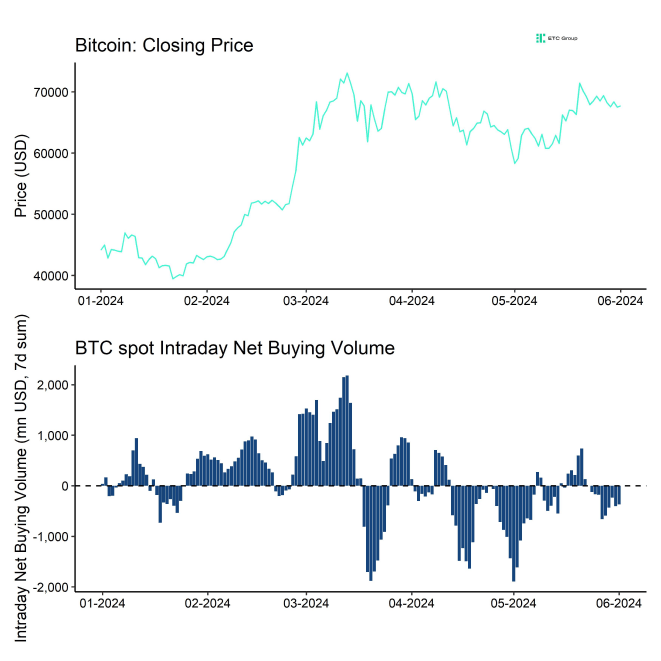
The recent decline in net buying volumes on Bitcoin spot exchanges appears to be due to the fact that whales have been net sellers of bitcoins more recently. In fact, Bitcoin whales have recently sent the highest net amount of bitcoins to exchanges year-to-date before withdrawing the most bitcoins since July 2022.
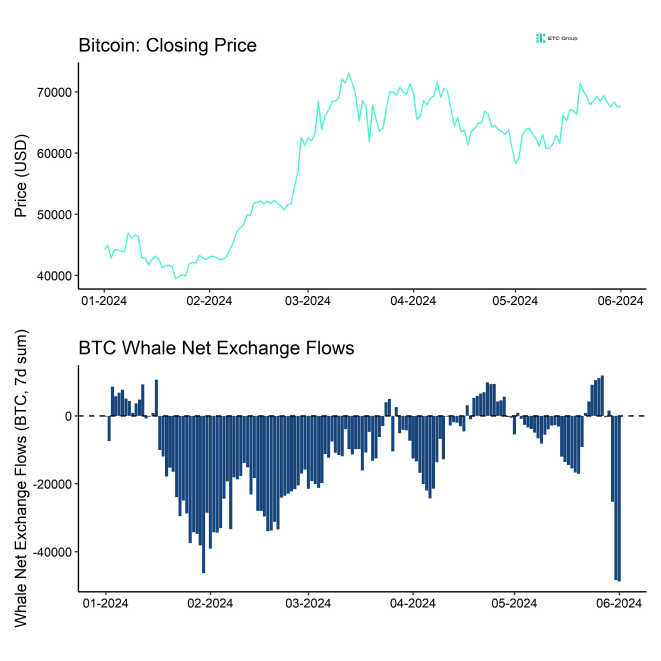
Whales are defined as network entities that control at least 1,000 BTC. It appears as if whales had started selling into the most recent rallye. In any case, potential selling pressure had temporarily increased.
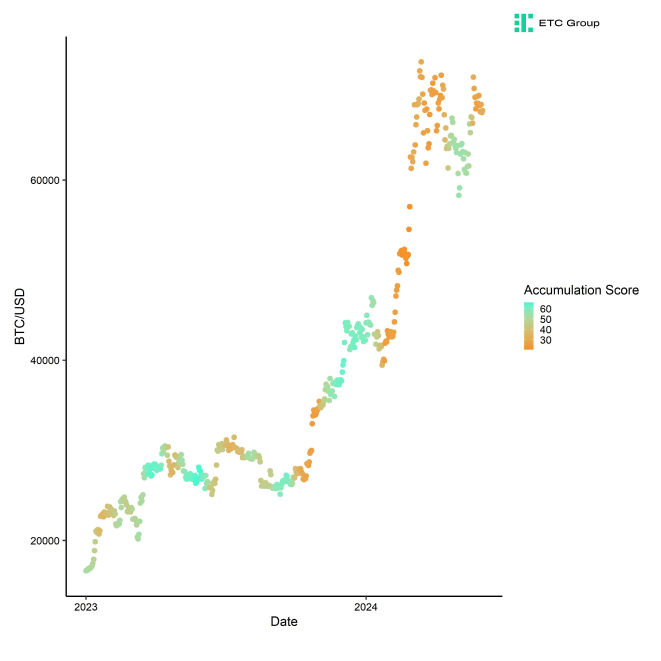
This is corroborated by the fact that accumulation activity has recently also slowed down significantly mostly due to a slowdown in small wallet cohort accumulation as well.
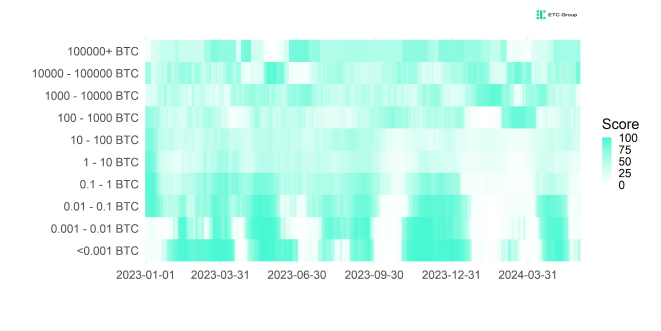
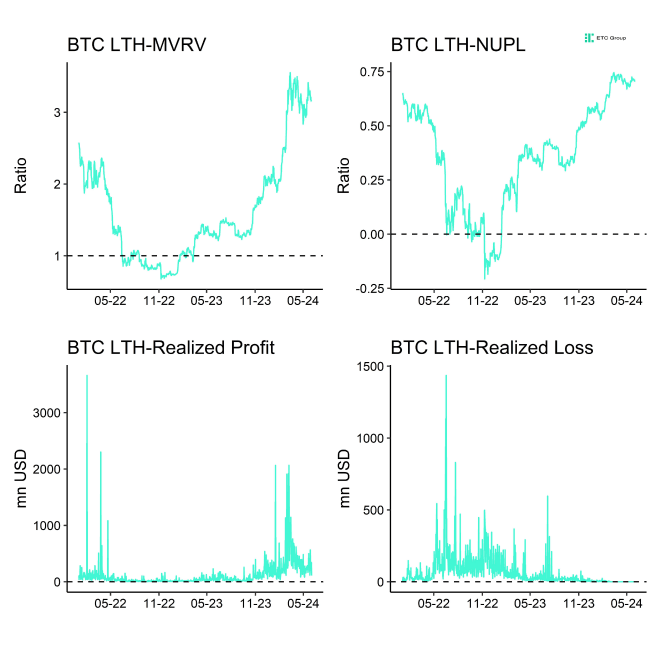
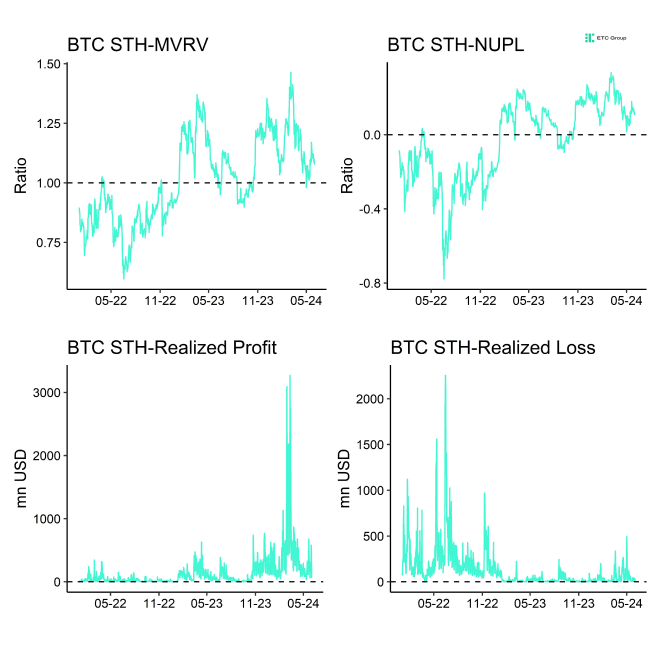
Looking at different investor types, long-term holders have recently started taking more profits. This could be related to the fact that the Mt. Gox trustee wallets have started sending some of the holdings which are highly in profit.
Markets have recently sold off in reaction to these movements which appear to be related to internal transfers between Mt. Gox cold wallets.
That being said, these transfers could be a signal for an upcoming distribution of those bitcoins on exchanges which would certainly exert significant pressure on the price of Bitcoin.
At the time of writing, the Mt. Gox trustee holds around 137,890 BTC according to data provided by Glassnode.
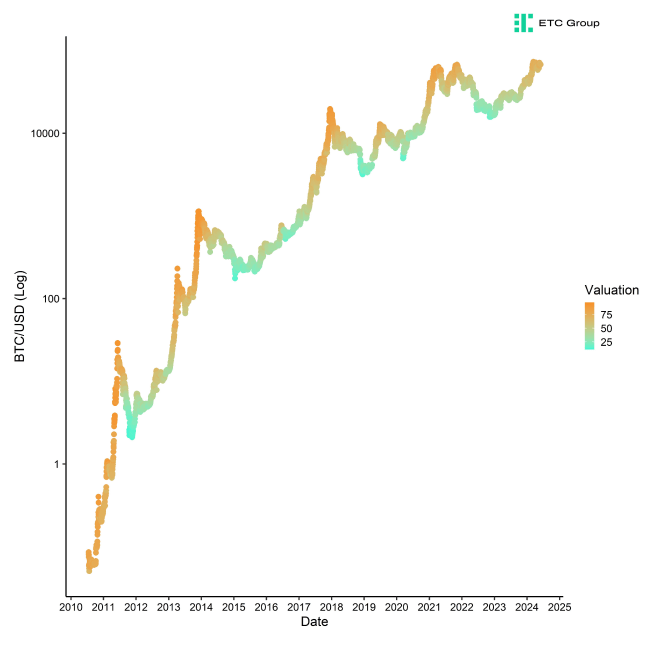
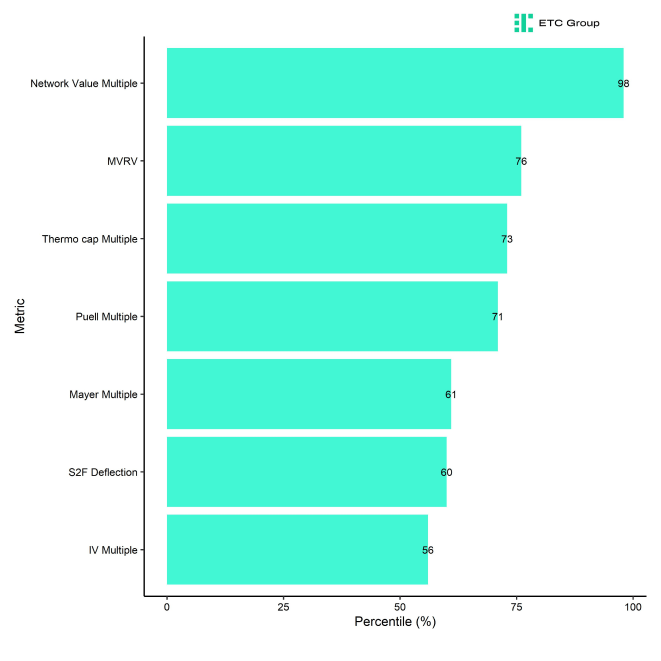
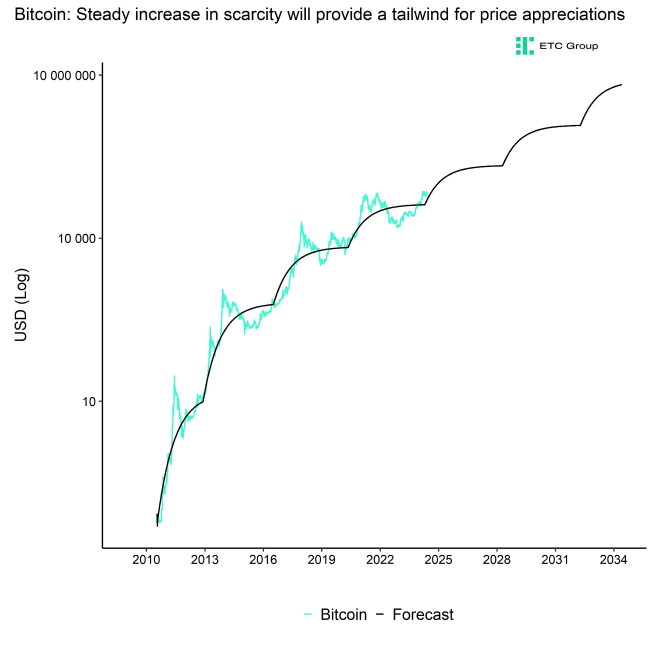
Bitcoin valuation metrics also remain somewhat elevated despite the recent Halving. Our own composite valuation indicator for Bitcoin which comprises of seven different on-chain valuation indicators is also still at 75% implying that Bitcoin is still “moderately expensive”.
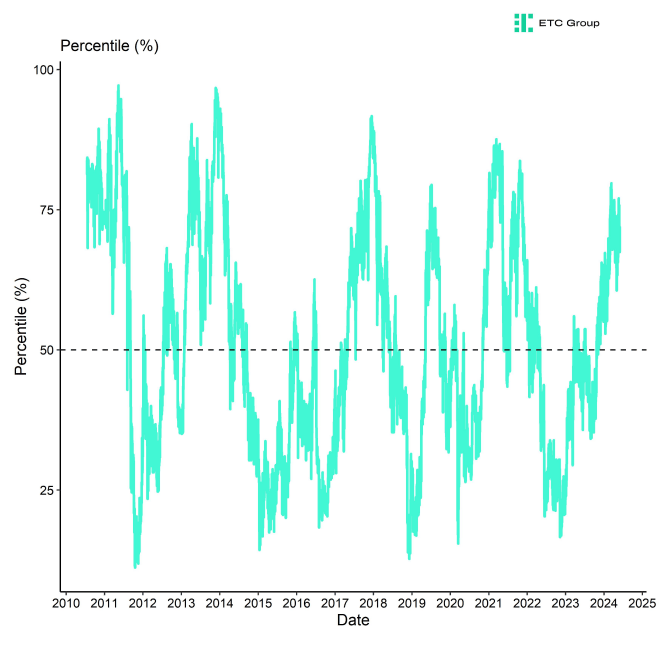
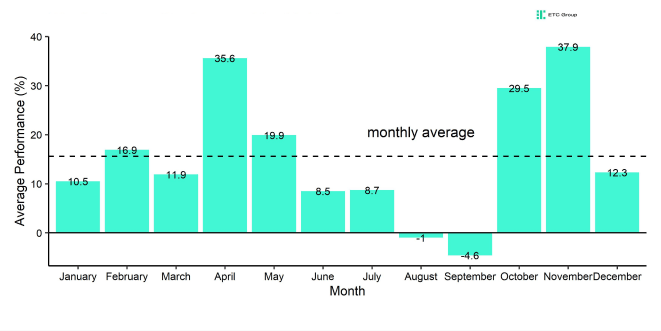
Our base case remains for a short-term weakness until the positive effect from the Halving starts to kick in around summer 2024.
We have analysed past Bitcoin Halvings statistically here.
This expectation is also supported by the fact that performance seasonality is relatively muted during the summer months from June until September.
Looking at the behavior of Bitcoin miners after the Halving we can say there is currently no evidence whatsoever for so-called “miner capitulation”.
- Hash rate has moved sideways since the Halving: there has been no significant increase but also no significant decrease either;
- Mining difficulty has been adjusted downwards at the beginning of May but the latest difficulty adjustment was up again;
- BTC mining balances have remained fairly stable with only minor distributions from miner wallets in mid-May;
- There have been no significant spikes in miner transfers to exchanges either.
Thus, there is no evidence of so-called “miner capitulation” so far amid the reduced block rewards induced by the Halving. Past post-Halving periods have seen large distributions in the years 2012 and 2016 with steep declines in aggregate BTC miner balances. That being said, the last post-Halving period from May 2020 onwards had only seen small declines in BTC miner balances.
Bottom Line: Our base case remains for a short-term weakness until the positive effect from the Halving starts to kick in around summer 2024. This is due to several different factors including a slowdown in ETF and on-chain flows, heightened valuations, increasing macro risks, increased whale selling pressure and unfavourable performance seasonality during the summer months.
Bottom Line
- Performance: In May, Bitcoin and cryptoassets outperformed traditional assets like equities, with Ethereum leading due to the Ethereum spot ETF approval in the US. There was no significant altcoin outperformance indicating a broader risk appetite return.
- Macro: Market liquidity is shifting, yet growth outlooks remain positive despite risks from Chinese monetary policy tightening and a potential US recession. Yield curve steepening suggests a US monetary policy turnaround, likely only with a US recession.
- On-Chain: A short-term weakness is anticipated until the Halving's positive effects emerge around summer 2024. Contributing factors include slowing ETF and on-chain flows, heightened valuations, increased whale selling pressure, increasing macro risks, and unfavourable summer seasonality.
Appendix
Cryptoasset Market Overview
Cryptoassets & Macroeconomy
Cryptoassets & Multiasset Portfolios
Cryptoasset Valuations

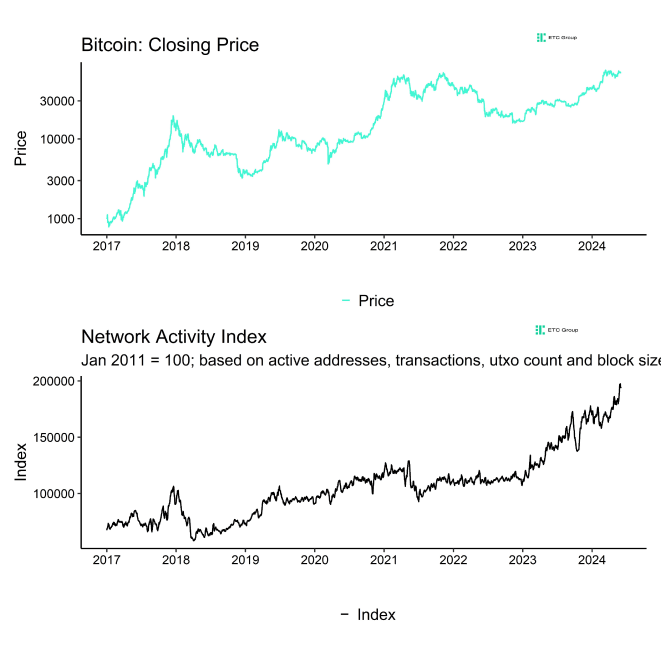
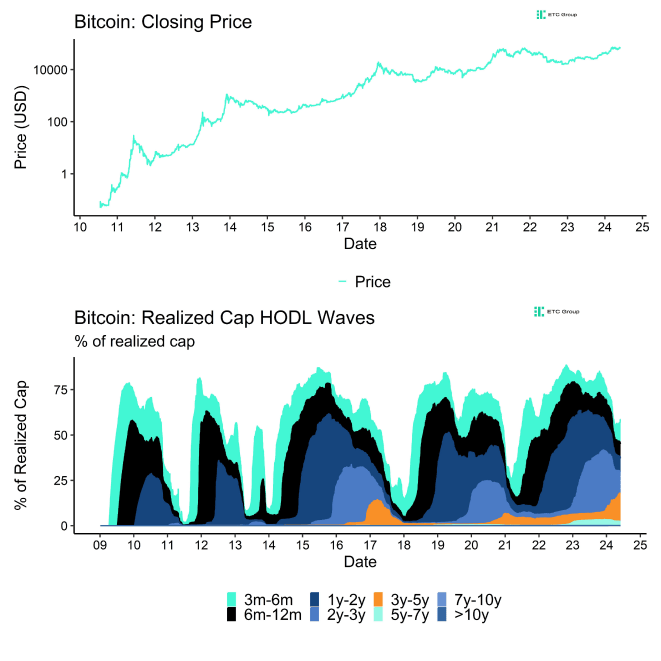
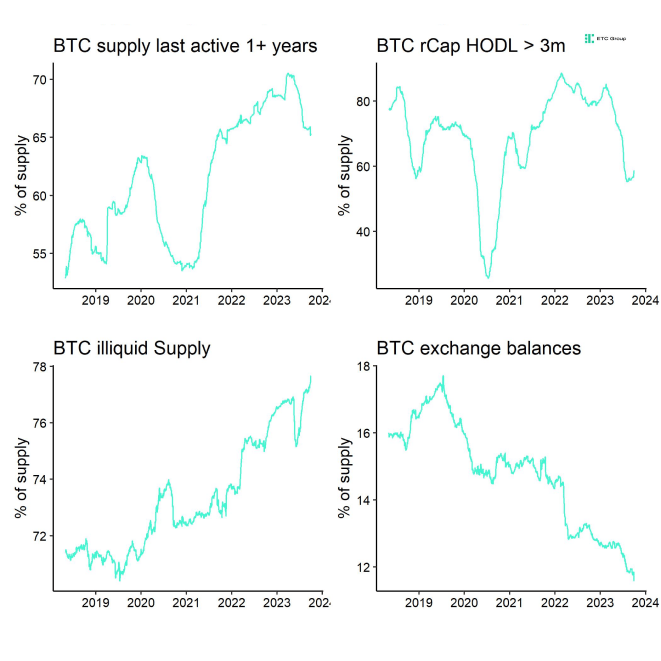
On-Chain Fundamentals

Important information:
This article does not constitute investment advice, nor does it constitute an offer or solicitation to buy financial products. This article is for general informational purposes only, and there is no explicit or implicit assurance or guarantee regarding the fairness, accuracy, completeness, or correctness of this article or the opinions contained therein. It is advised not to rely on the fairness, accuracy, completeness, or correctness of this article or the opinions contained therein. Please note that this article is neither investment advice nor an offer or solicitation to acquire financial products or cryptocurrencies.
Before investing in crypto ETPs, potentional investors should consider the following:
Potential investors should seek independent advice and consider relevant information contained in the base prospectus and the final terms for the ETPs, especially the risk factors mentioned therein. The invested capital is at risk, and losses up to the amount invested are possible. The product is subject to inherent counterparty risk with respect to the issuer of the ETPs and may incur losses up to a total loss if the issuer fails to fulfill its contractual obligations. The legal structure of ETPs is equivalent to that of a debt security. ETPs are treated like other securities.
 En
En  De
De 